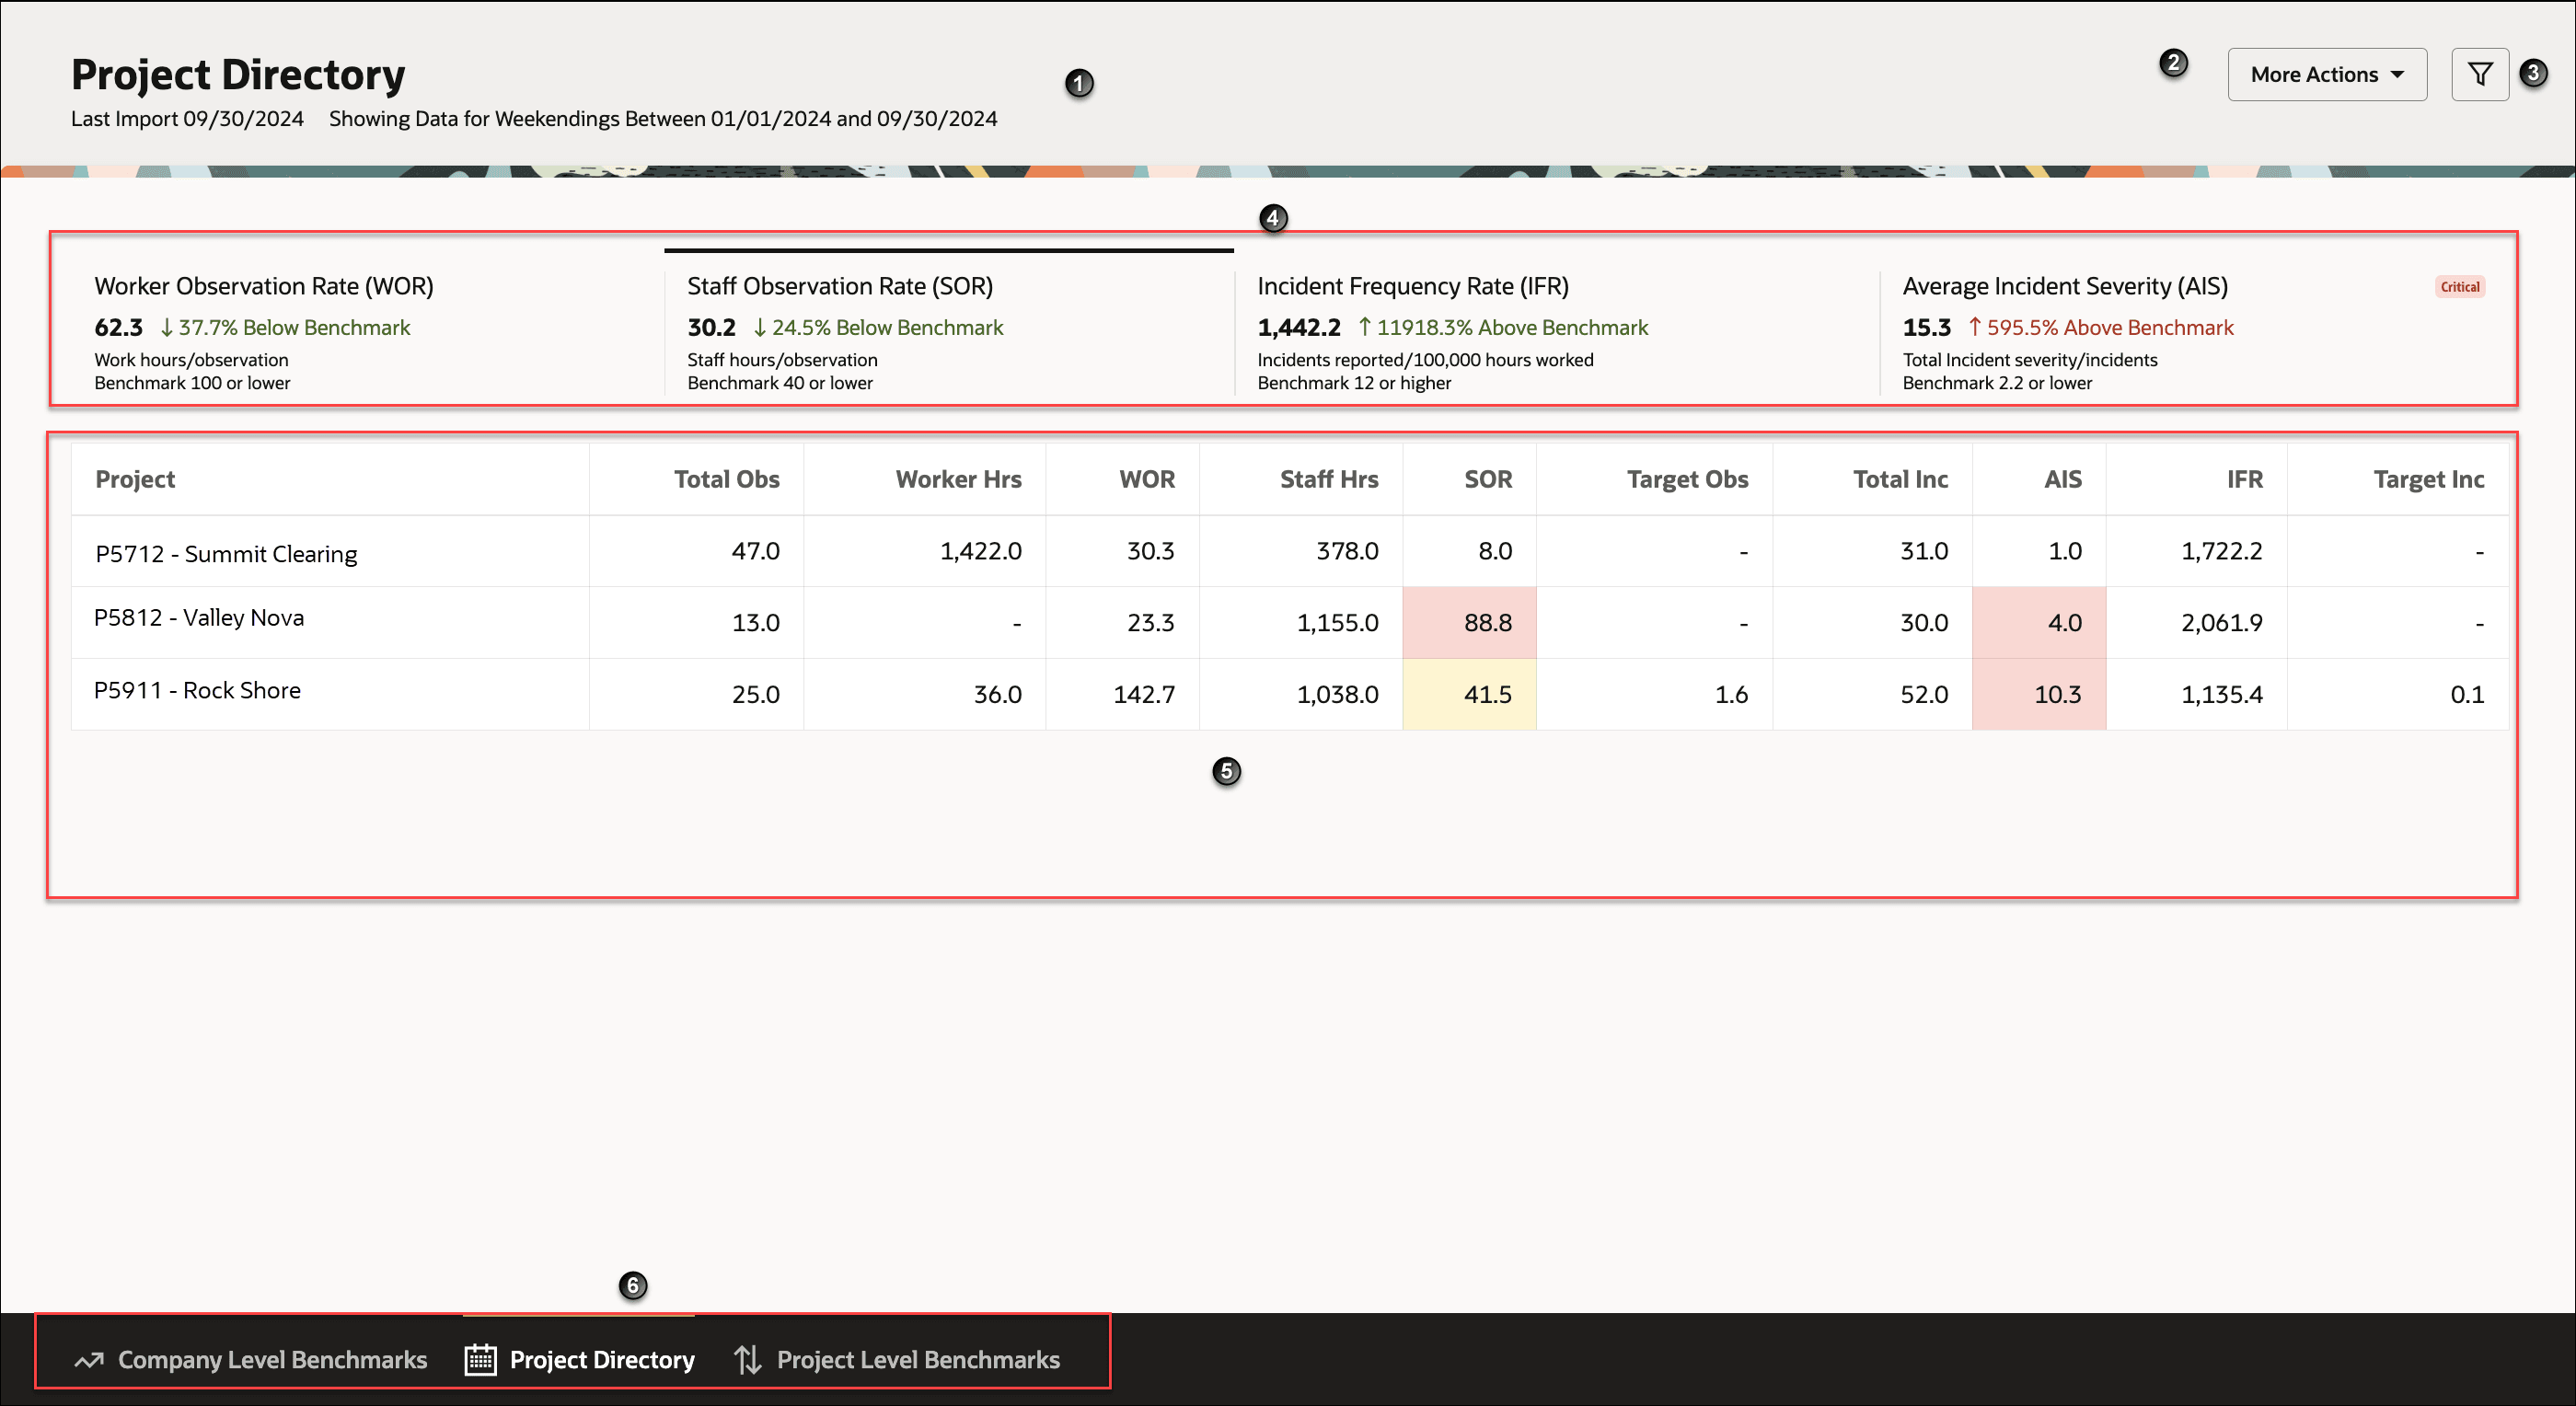
Project Directory
Use the Project Directory dashboard to view safety metrics for a selected list of projects.
The dashboard displays key data to help you view how projects are performing against predefined safety benchmarks. You can use this dashboard to:
- See how selected projects are comparing against predefined safety benchmarks.
- Identify project safety metrics that are either below or above thresholds. The metrics are color coded for easy identification.
- Filter the projects list to expand or narrow your search criteria.
- View the following safety metrics for all selected projects: WOR, SOR, IFR, and AIS. For more information, see About Benchmark Metrics.
- View the data driving the metric results.

The following screen elements are displayed on the Project Directory dashboard:
| Screen Elements | Description |
|---|---|
| 1 | Displays the time the data was imported. |
| 2 |
More Actions drop-down menu:
|
| 3 | Filter icon. Select to filter on date range. The options include: Latest Import, All Time, Last Week, Month to Date, Quarter to Date, and Year to Date. |
| 4 |
Metrics Tiles - Each tile displays the following information:
For a description of the metrics, see About Benchmark Metrics. |
| 5 |
Metrics Table - Provides detailed statistics for the observations and incidents recorded at the project level. The following information is displayed:
|
| 6 | Tabs to navigate to the Company Level Benchmark, Project Details, and Project Level Benchmarks pages. |
How to use the dashboard
- Choose the projects to compare:
- From the More Actions drop-down list, choose Select Projects.
- From the Select Projects for Comparison dialog box, select your projects and click Apply.
- View the high-level metrics for all projects displayed on the Metrics Tiles.
- Compare the metrics for each project. The metrics are color coded for easy identification.
- View the data used to generate the table. From the More Actions drop-down list, choose View Data.