Overview and Concepts
What Visual Explorer Does
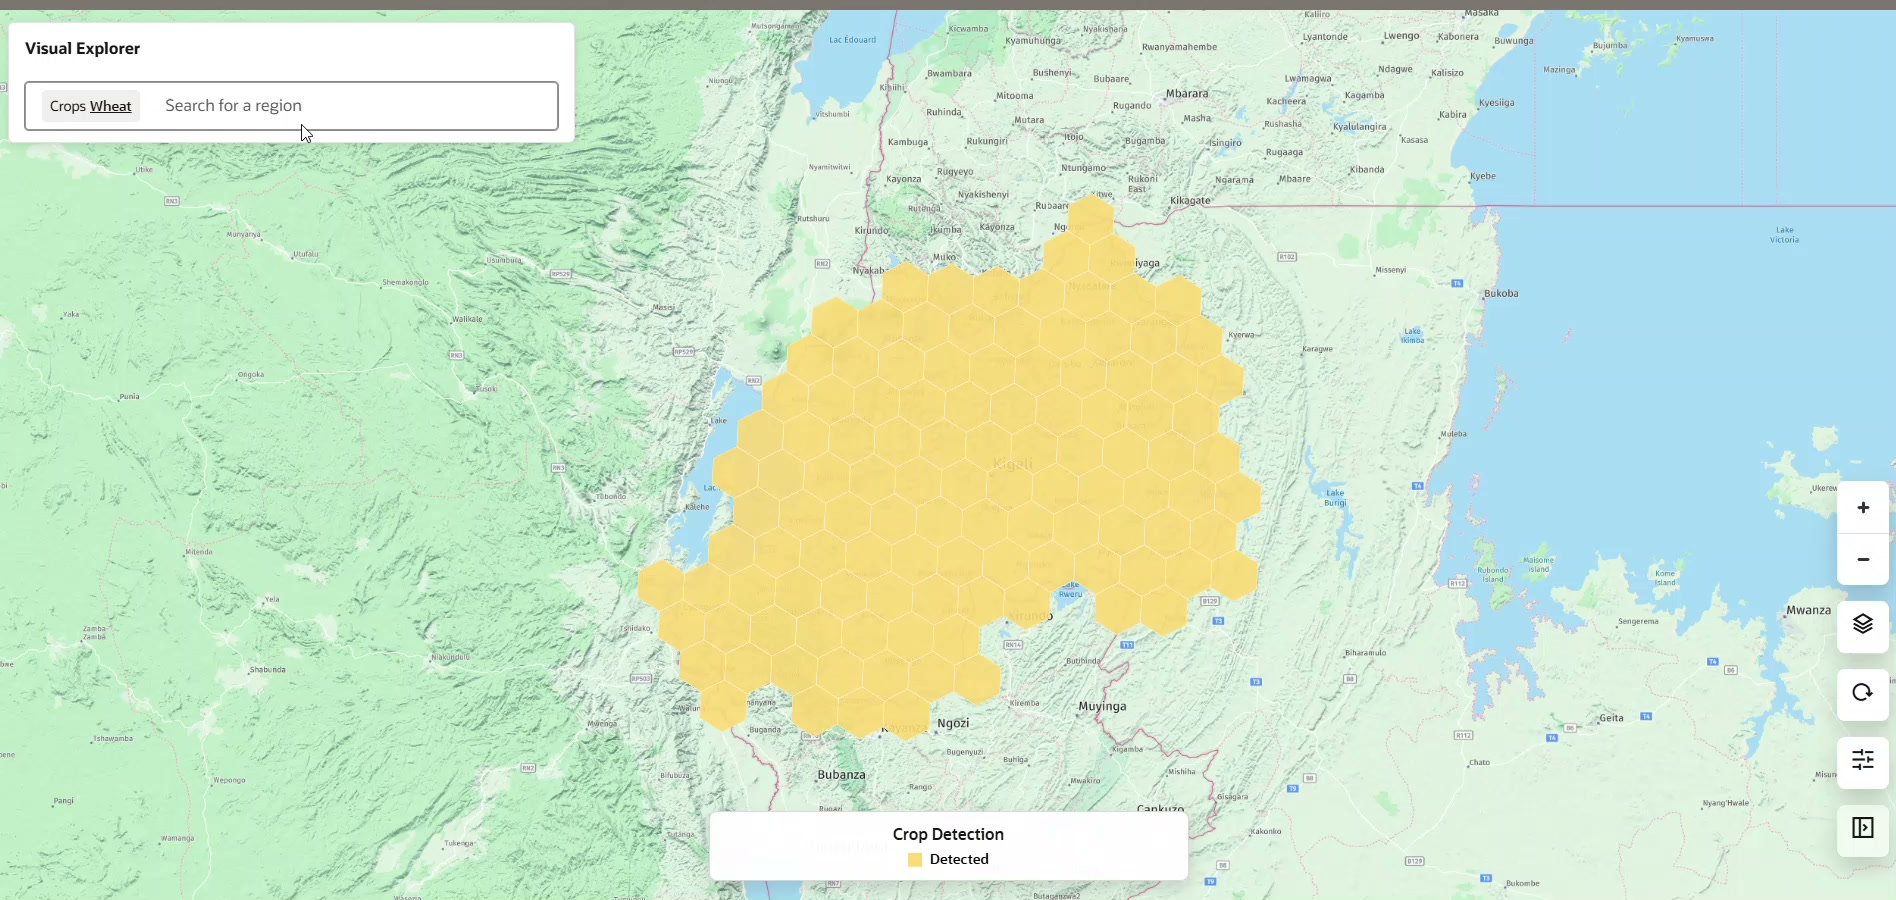
Visual Explorer turns the Agriculture Intelligence digital twin into a map-based exploration experience. It helps analysts, policymakers, and program teams understand agricultural patterns across a country, region, or lower-level administrative area.
Use Visual Explorer to:
- explore crop detection, crop health, and crop production layers;
- focus the map on a region and crop;
- inspect map detail at the appropriate zoom level;
- review production forecasts, historical values, and sub-region comparisons; and
- download available data for reporting and further analysis.
For the value this provides to public-sector teams, see Value of Visual Explorer. For guidance on choosing and interpreting each layer, see Interpret Layers and Scale.
Core Concepts
| Term | Meaning |
|---|---|
| Digital twin | The continually updated agricultural data foundation that combines satellite-derived observations with configured country and reference data. |
| Layer | A map view of a particular data type, such as Crop Detection, Crop Health (NDVI), or Crop Production. |
| Detection date | The date shown for an available satellite-derived dataset. Confirm it when interpreting or sharing map information. |
| Region hierarchy | The configured country and administrative levels used to search, select, summarize, and compare areas. |
| Yield category | A crop-specific interpretation of a forecast yield value, shown with a map color and badge where crop-production data is available. |
Start an Exploration
- Open Visual Explorer.
- Select a layer from the data-layers control.
- Select a crop when the layer requires one.
- Search for or select a region to set the map context.
- Confirm the available detection date shown for the selected layer.
- Pan, zoom, and select map features to investigate the data.
The available controls reflect the selected layer and the data configured for your country.
Interface label: Visual Explorer displays the detection date as Data acquired. Throughout this guide, detection date refers to that displayed dataset date.
Next: Explore the Map.