Email Introduction AMI Customer Education Report
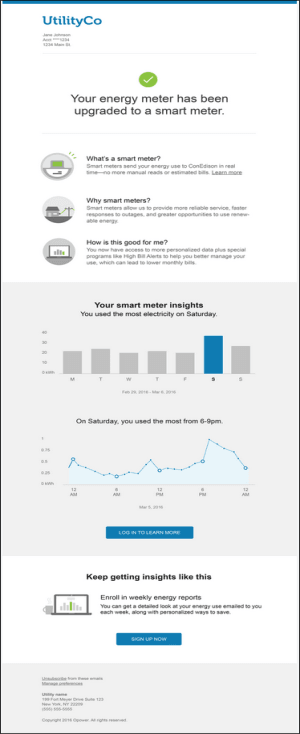
The email Introduction Customer Education Report is the first report in the program. By default, it is delivered 30 days after smart meter installation. It provides an introduction to smart meters as well as personalized hourly and daily energy use insights. It also encourages customers to engage with other AMI programs and communications offered by the utility.

Header, Footer, and Subject Line
The email subject line indicates that the customer's energy meter has been upgraded to a smart meter.
The header includes the utility logo, customer name, and customer account number. If a customer experiences any problems viewing the email, they can click a link to indicate that they are having trouble viewing the email. The email will then appear correctly in a web browser.
The footer includes an unsubscribe link, a link to manage email preferences, utility information, copyright information, and optional disclaimer text. An unsubscribe link and the utility email address must appear due to CAN-SPAM regulations in the US and similar regulations abroad.
Smart Meter FAQs
Frequently Asked Questions (FAQs) about smart meters are displayed at the bottom of the front page of the report. The FAQs define what smart meters are in simple terms, and describe the benefits of smart meters for both the utility and the customer.
Day By Day Breakdown
The Day by Day Breakdown module shows how many kilowatt-hours (kWh) the customer spent each day of the previous week. Each bar in the graph represents the kWh total for the corresponding day, and a blue bar represents the day on which the most kWh were used.
Hourly Breakdown
The Hourly Breakdown module contains a line graph that shows a 24 hour breakdown of the highest usage day from the previous week. For example, if a customer used the most electricity on Saturday, an hourly breakdown for Saturday is shown.
Customers can click on the graph or on a Log In To Learn More button below the graph to open the Data Browser in the Oracle Utilities web portal, if applicable. The Data Browser is an interactive tool that allows customers to visualize and explore their energy use trends and costs, and make comparisons to useful benchmarks, such as weather and similar homes.
Sign Up
The Sign Up module encourages customers to enroll in other AMI communications offered by the utility, such as Oracle Utilities Weekly Energy Updates. A custom link can appear in this module to direct customers to a web page where they can find more information.