Print Introduction AMI Customer Education Report
The print Introduction Customer Education Report is the first report in the program. By default, it is delivered 30 days after smart meter installation. It provides an introduction to smart meters as well as personalized hourly and daily energy use insights. It also encourages customers to engage with other AMI programs and communications offered by the utility.
Report Front
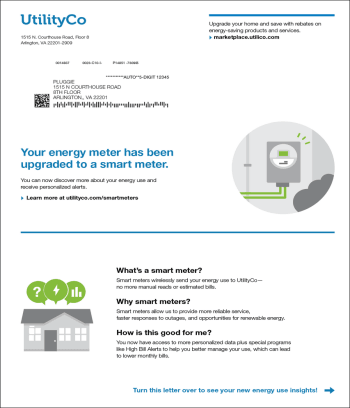
The front page of the report includes a header and footer, custom marketing module, and smart meter FAQs.

Header and Footer
The header appears in the top section of the front of every report. The left side of the header contains the customer mailing address box, utility return address box with utility logo, customer account number, and customer service address. The mailing and return addresses are placed so that they show through the two windows in the envelope. The right side of the header contains introductory information about the report. An additional message and optional URL may appear below this content to highlight other details about the report or utility programs.
A footer on the front page of the report contains a prompt to turn over the report.
Marketing Module
A custom marketing module can be used to advertise utility tools and programs available to AMI customers. For example, utilities could provide information about AMI tools available on the Oracle Utilities web portal or encourage customers to enroll in other Oracle Utilities AMI communications, such as Weekly Energy Updates.
Report Back
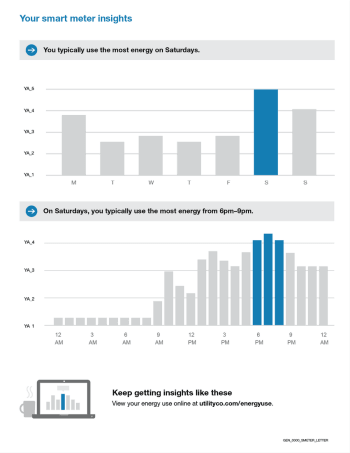
The back page of the report contains personalized smart meter insights and a URL where customers can enroll in other Oracle Utilities AMI communications. See the module descriptions below for more information.

Day By Day Breakdown
The Day by Day Breakdown module shows how many kilowatt-hours (kWh) the customer spent each day of the previous week. Each bar in the graph represents the kWh total for the corresponding day, and a blue bar represents the day on which the most kWh were used.
Hourly Breakdown
The Hourly Breakdown module contains a bar graph that shows a 24 hour breakdown of the highest usage day from the previous week. For example, if a customer used the most electricity on Saturday, an hourly breakdown for Saturday is shown.
Sign Up
A module at the bottom of the back page of the report describes the AMI communications that are available to the customer and encourages them to enroll in these communications to continue receiving smart meter insights. A custom URL directs customers to a utility web page where they can learn more.