View the Storm ERT Dashboard
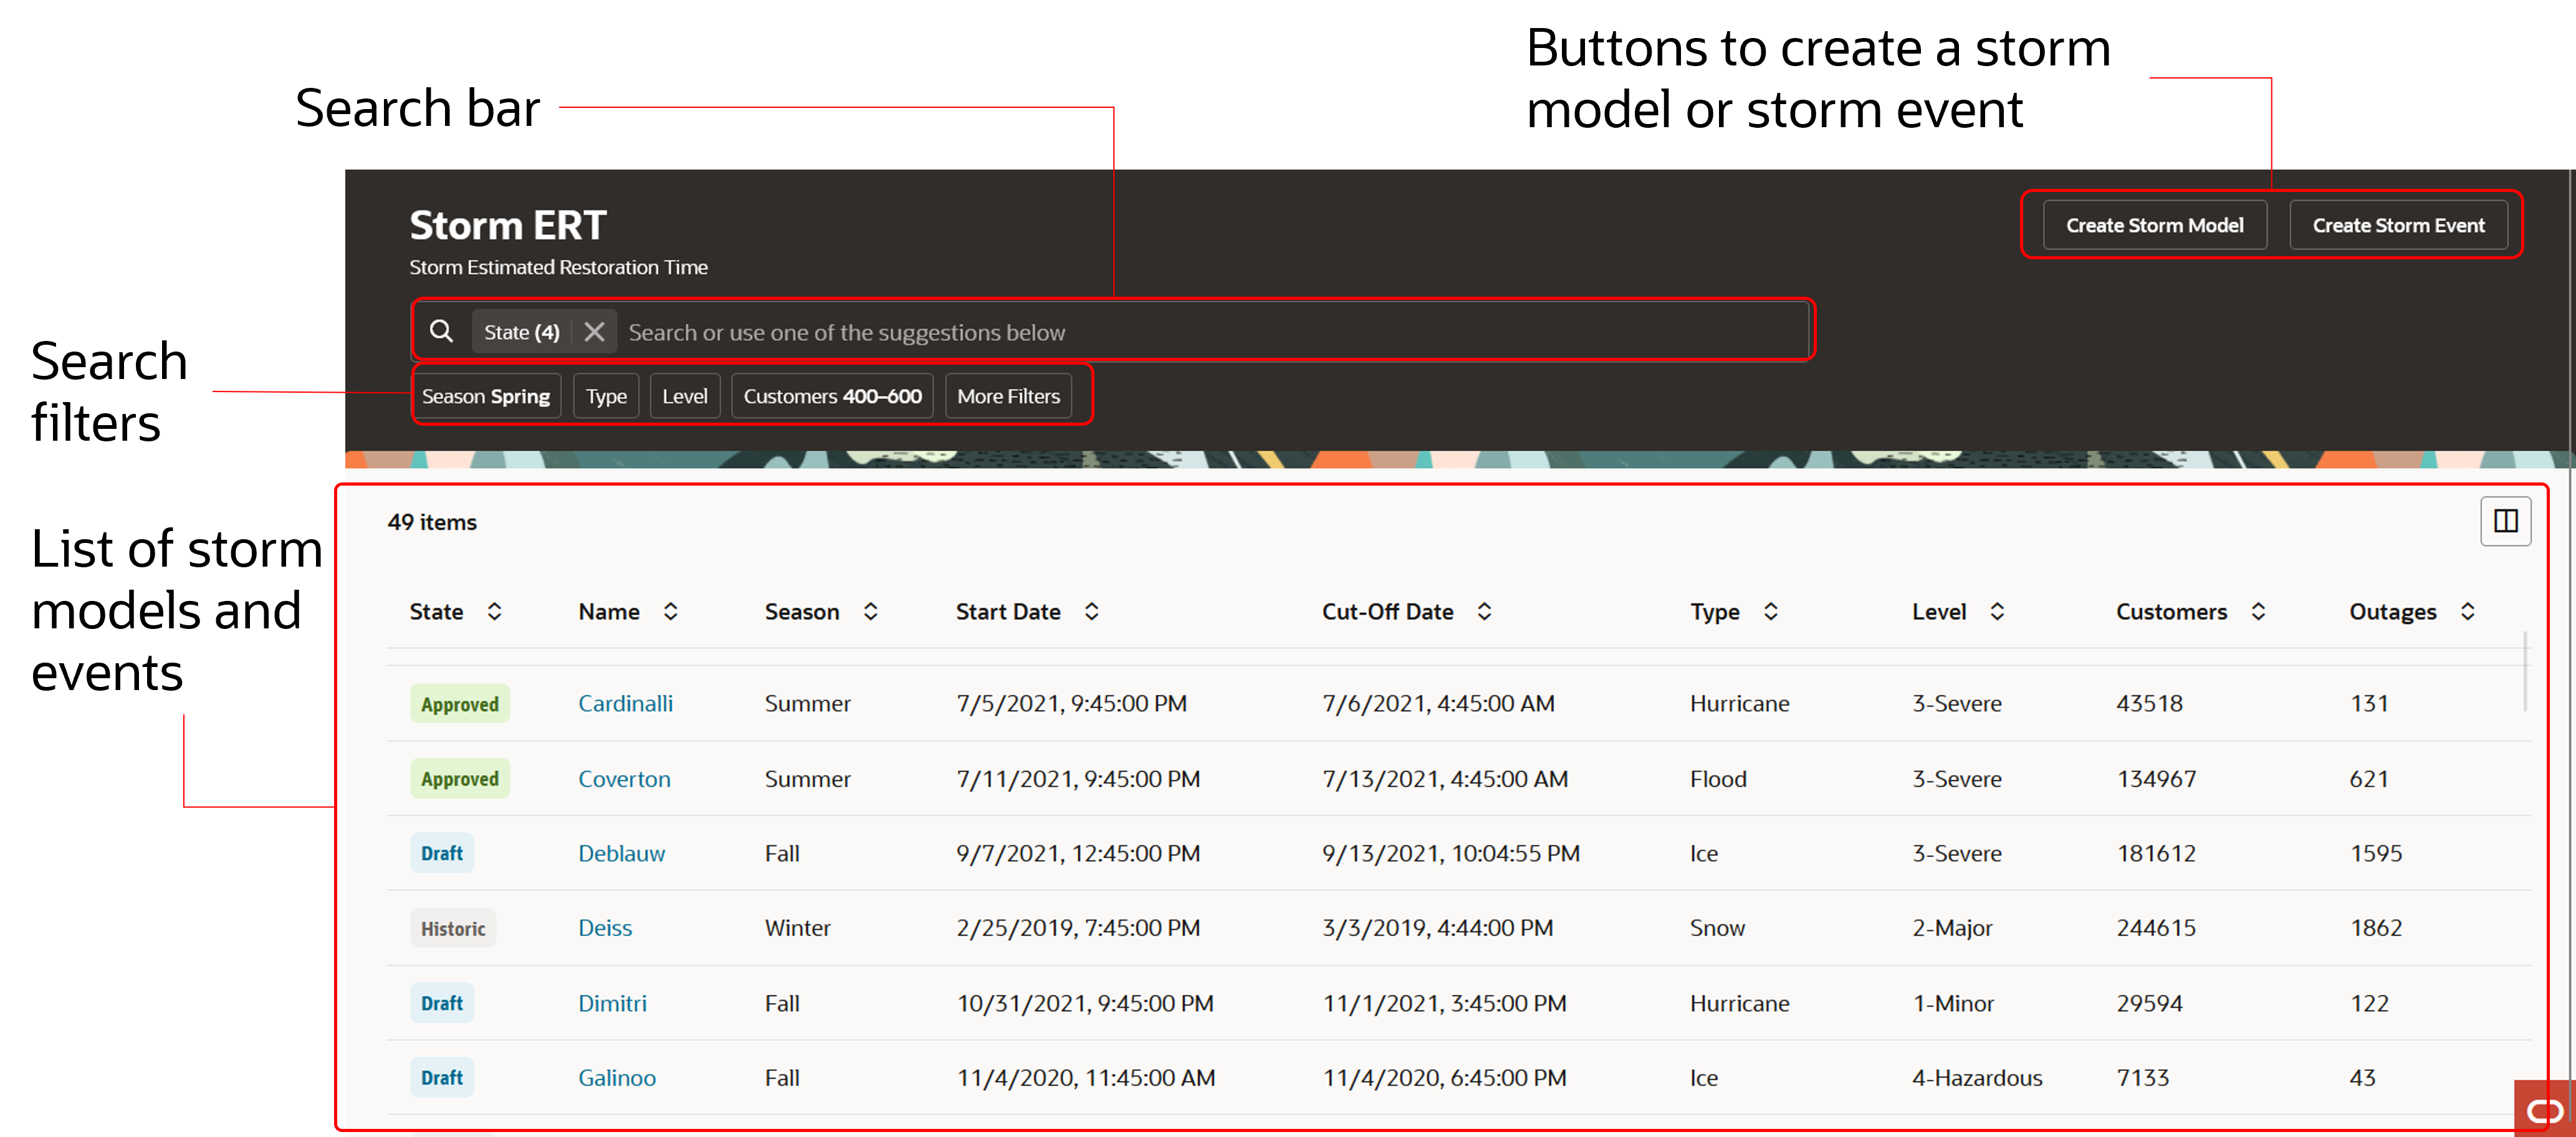
When you open the Storm ERT application, it displays a dashboard containing a search bar, search filters, buttons to create a storm model or event, and a list of storms you can click for more details. A storm is categorized as either a storm model or a storm event. A storm model allows you to estimate how long it will take to restore outages in an upcoming storm, whereas a storm event allows you to define the actual restoration timeline of a storm that occurred in the past so it can be used in future storm ERT calculations.
On this page:
Search
The search bar lets you use keywords to find a storm model or event. You can enter the name of a storm in the search bar if you already know what it is. You can also search for other key words to return a wider range of results. See Search for a Storm Model or Event.
Create Storm Model
A storm model defines when a storm will come and estimates how long it will take to restore power to customers who lose power as a result of the storm. After this information is defined, you can add an estimated restoration timeline (ERT) to the model, which displays a line graph for easy analysis. See Create and Manage Storm Models for more information.
Create Storm Event
A storm event defines the actual restoration timeline of a storm that occurred in the past, which can then be used in the ERT calculations of a storm model for an upcoming storm. Any storm in the Historic state is a storm event. After the storm event's parameters are defined (such as the start date and cut-off date), outage information from the Oracle Utilities Network Management System (NMS) or another connected outage management system is imported into the storm event based on those parameters. See Create and Manage Storm Events for more information.
Filters
A series of filters below the search bar allows you to narrow the list of storm models and events. Several default filters are displayed for quick selection. Click More Filters to select additional ones. Most of the filters are based on the columns in the list of storm models and events displayed under the search bar. See List of Storms Models and Events below for details.
Note: Historic storm events imported from a third-party system may have Type and Level values that differ from the defaults configured in the Storm ERT application. In these cases, the Type and Level columns in the dashboard will contain the imported values. If an imported storm does not have these fields populated, a blank space will be shown. If you need to edit an imported historic storm event, you must select new Type and Level values as part of the storm event editing process, or clear the imported values before saving your edits. See Create and Edit a Storm Event for details.
List of Storm Models and Events
The dashboard includes a list of storms, each of which is displayed as a row in a table-like view. Each row includes columns about a storm, such as the state, name, start date, and so on. You can use a column picker to add or remove columns from the list, or to rearrange the order of columns. (You can use the same column picker button to restore the default column arrangement at any time.)
|
Column |
Description |
|---|---|
|
The status of the storm model or event. A storm model can be in a Draft, Approved, Archived, or Cancelled state. Storm events can only be in a Historic or Cancelled state.
|
|
|
Name |
The name of the storm model or event. |
|
The season in which the storm occurred. Each season represents a specific date range. When you create a new storm, the season auto-populates based on the start date. The following is the default season configuration:
Note: Seasons are configurable. You can work with your Oracle Delivery Team to change the default date ranges to accurately match when each season takes place in your service territories. If a storm does not have a season listed, then the seasons were not configured consecutively. For example, let's say that spring is configured to occur from March 1 to May 13, and summer starts on June 1. In this case, any storms that start between May 14 and May 31 will not have a season. |
|
|
Start Date |
The date and time when the storm entered (or is expected to enter) the service area. |
|
Cut-Off Date |
The date and time after which new outages will be excluded from the storm model. This is usually the date and time when the storm leaves your service territory, but not always. |
|
Type |
The specific type of storm. The storm types are configurable. The default types are:
|
|
Level |
The severity level of the storm. The severity levels are configurable. The meaning or criteria for each level may vary by utility. The defaults are:
|
|
Customers |
The number of customers who lost power (or who are expected to lose power) during the storm. This is different than the number of outages. |
|
Outages |
The number of outages expected to occur during a storm. This number should be less than or equal to the number of customers who may lose power during the storm. This is because an outage can affect multiple customers simultaneously, such as when a poll is down or a transformer is damaged. |