Bill or Usage Forecast
The Bill or Usage Forecast shows business customers their energy use or cost so far in the billing period, projected total energy use or cost for the period, and typical energy use or cost for the period based on their past energy use. The forecast informs customers before the end of the billing cycle if they are likely to have high energy use or cost compared to the same time period from the previous year.
On this page:
Requirements
Utility Requirements
Same as listed in the product-wide requirements.
Customer Requirements
|
Category |
Description |
|---|---|
|
Billing Frequency |
Monthly, bi-monthly, and quarterly. |
|
Data Delivery Frequency |
The utility must be able to deliver customer data to Oracle Utilities within 48 hours from the time of the last data read. |
|
Data Requirements |
Billing Data: Billed usage data from the utility is required. AMI Data: Daily, hourly, or subhourly AMI data is required. Rates Data: The Rates Engagement cloud service must be purchased and rates must be modeled for rates-based insights to appear. Contact your Delivery Team if you have questions about this cloud service and whether your rate structure can be supported. |
|
Data History |
The business customer must have at least one historical bill in order for the forecast to be calculated. A year's worth of billing history is required to show the customer how their forecast compares to their typical usage from the same time last year. If the customer does not have a year's worth of billing history, they are still shown their current and projected usage or costs. |
|
Data Coverage |
The business customer must have AMI data going back to the beginning of the current billing cycle. By default, at least 75% of the possible reads for the current billing cycle are required to calculate the forecast. For cost forecasts, at least 95% of AMI usage reads must have rates modeled in order to ensure an accurate cost projection. |
|
Supported Fuels |
Electricity, gas, and dual fuel. |
User Experience
The user experience described in this section is for business customers who receive electric and gas service from their utility, and usage rather than cost information in their forecast.
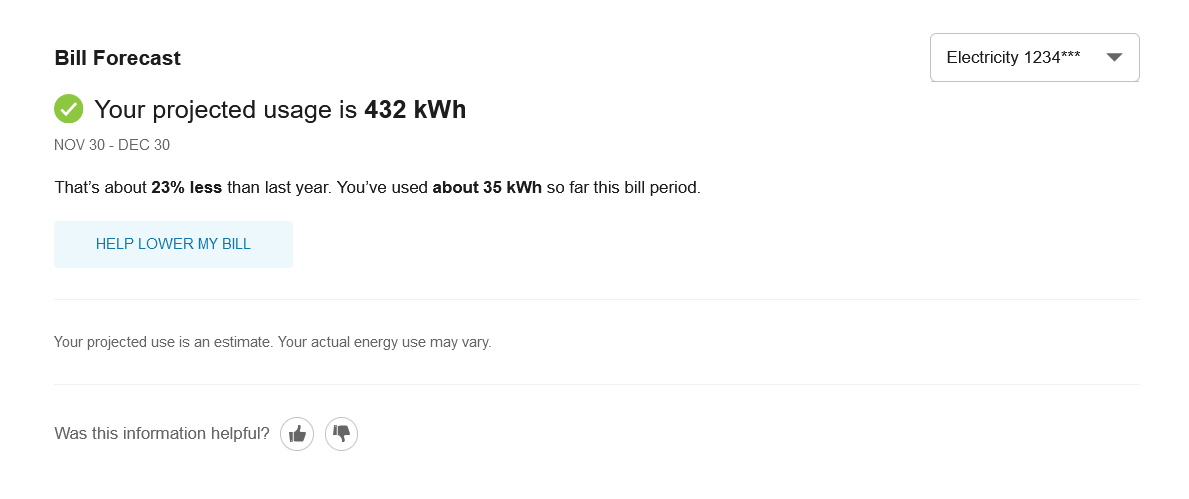
Fuel Drop-Down Menu: The fuel drop-down list allows business customers to select which fuel to view a forecast for. By default, the Electricity fuel label is shown. Gas is the second label. A fuel drop-down only appears for dual fuel customers and is hidden for single fuel customers.
Forecast Amount: The forecast amount is a projection of how much the customer's usage or bill could be if they continue their current energy-spending behavior through the end of the billing period. The forecast is an estimate, not an exact amount, and is based on the estimated length of the bill. If cost information is displayed, it is rounded to the nearest $5 to reinforce the fact that it is an estimate. Depending on your setup and configuration, the forecast may show a cost range instead of a specific cost.
Normative Symbol: The normative symbol adds meaning to the forecast by providing a visual indication of how well the customer is doing and showing whether or not their cost or energy use is unusual compared to their typical cost or energy use. A threshold controls which icon displays. The default threshold is that the customer must use more than 30% above their baseline to see a high bill alert.
|
Condition |
Experience |
|---|---|
|
Customer is using less than or equal to 30% above their baseline |
Check mark |
|
Customer is using more than 30% above their baseline |
Exclamation point |
|
Customer will see a forecast calculated in n days |
Information icon |
|
Customer does not have a baseline or estimated bill period |
Information icon |
Billing Period Date Range: The billing period shows the start and end date that the forecast covers. It comes from the average bill period length, which is estimated based on a customer's AMI data and bill period end date. This component may be hidden if there is not enough AMI data to estimate the average length of a customer's billing periods. For example, there may be two days of AMI data for the customer, but not enough historical AMI data to know how long their average bill period is throughout the year.
Comparison Message: The comparison message explains how much money or energy the customer is on track to spend compared to the same bill period from the previous year. The message varies slightly depending on the customer's performance and what data is available.
Spent So Far: A message explains the cost or usage so far in the billing period, which is the basis for the projection.
Help Lower My Bill: This link directs customers to energy efficiency tips to help them save money and energy. See Ways to Save for more information.
Disclaimer about Estimated Bill: The widget includes a brief explanation of how the bill or usage projection is estimated and can vary from a customer's final bill or usage amount.
Customer Feedback: A customer feedback section is displayed at the bottom of the forecast to gather information about the usefulness of the feature.
User Experience Variations
Forecast Lower Than Cost or Usage to Date
There may be a case where a business customer's cost or usage forecast is rounded down to the nearest five and becomes less than the customer's cost or usage to date as a result.
For example, it may be late in the billing period and the customer's cost to date is $41. If the widget calculates a cost forecast of $42, then it would round this number down to $40. However, this would be a confusing user experience, since the forecast would say $40, whereas the cost to date would say $41. Therefore, for these situations, there is logic in the widget to keep the original $42 forecast, instead of rounding down to the nearest five. This is the only case in which the calculation rounds to the nearest whole number instead of the nearest five.
Mobile Experience
The Bill Forecast is designed to adapt smoothly to both mobile and desktop screen sizes. When the screen size changes, the layout of the feature changes dynamically to reduce the size of the elements and keep them stacked vertically.
Multiple Accounts
The multiple accounts experience varies depending on whether the feature has been configured for a standalone implementation or an embedded implementation.
In a standalone implementation, the Bill Forecast shows a drop-down list that allows business customers to choose which account to view.
In an embedded widget implementation, the account drop-down is hidden since the utility site is expected to have its own account selection tools. In this case, customers can switch between their accounts by logging into their utility account using single sign-on, and then clicking an account selector hosted on the utility website. All embedded widgets are then reloaded with data for the specified account.
Multiple Service Agreements
The multiple service agreements experience may vary depending on whether a utility uses the Legacy Data Transfer specification or one of the latest core data transfer specifications (Account, Billing, or Premise). Your Delivery Team can tell you which specification you are using.
The Bill Forecast handles the forecast for service agreement(s) within a single billing account. A drop-down menu is displayed when there are multiple service agreements for a billing account. If your customer has multiple service points (that is, multiple meters) for a single service agreement, the drop-down menu will not display.