Energy Use Benchmark
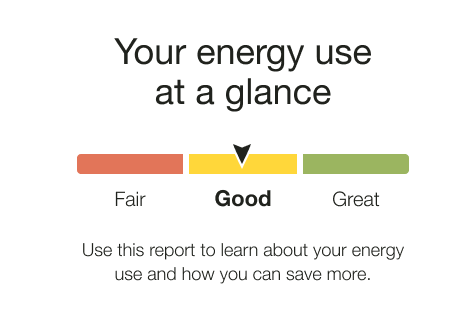
The Energy Use Benchmark module provides a dynamic and personalized, at-a-glance interpretation of the customer’s energy use. Energy use is categorized into one of the three sections or statuses: Fair, Good, and Great. The customer's status is determined by their performance relative to their Efficiency Zone or Neighbor Comparison modules.
Appears in: Progress Report , Limited Income Report, Time of Use Report, Solar Report
Design
Energy Use Benchmark
This image shows an example of the Energy Use Benchmark module's design for the Progress Report , Limited Income Report, and Time of Use Report.
Solar Energy Use Benchmark
The Solar Energy Use Benchmark accommodates negative energy states experienced by solar customers.
This image shows an example of the Solar Energy Use Benchmark.
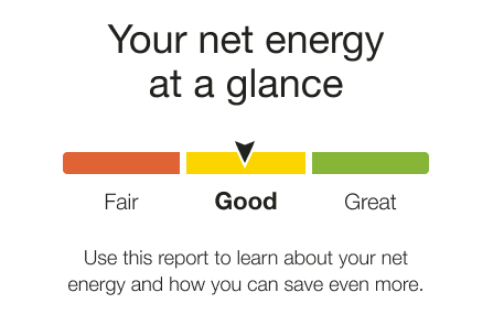
Heading: The heading notifies the customer that the energy use benchmark gives them an at-a-glance view of their net energy use.
Energy Use Benchmark: The benchmark gauge is broken into three sections: Fair, Good, and Great. A customer's status on that gauge is determined by their performance relative to both comparison points in the three-bar neighbor comparison. A customer's performance is indicated with an arrow that sits in the middle of a given segment of the gauge. Each state has a corresponding color:
- Orange: Fair. The customer's net energy was positive and more than similar homes.
- Yellow: Good. The customer's energy use falls into one of the following categories:
Net energy was positive and less than similar homes
Net energy was negative and more than similar homes
Net energy was negative and more than efficient homes, but less than similar homes
- Green: Great. The customer's net energy was positive or negative and an efficient home.
- Yellow: State Change (High to Low)..The customer's benchmark state has changed from Fair to Good or Good to Great since the last report.
Benchmark Copy: The copy below the gauge tells the customer how they can leverage the report or recognizes the customer's lower net energy use.
Configuration Options
For each element listed in the table, indicate the desired configuration in the Input Value column. If you do not provide an input for optional configurations, the default will be used.
| Configuration Option | Input Value |
|---|---|
|
Benchmark Header The heading notifies the customer that the benchmark gives them an at-a-glance view of their energy use. It also includes the customer's fuel type.
|
Optional Contact your Delivery Team about configuring the benchmark header. |
|
Color Labels The benchmark has three potential states, and each corresponds to a color. The labels (Fair, Good, and Great) are configurable. However, the default labels and colors have been rigorously tested to maximize user comprehension and are strongly recommended. Progress Report, Limited Income Report, and Time of Use Report Default:
Solar Report Default:
|
Optional Choose one of the following:
|
|
Benchmark Copy The copy below the gauge tells the customer how they can leverage the report or recognizes a change in state. Default:
|
Optional Choose one of the following:
|
User Experience Variations
The user experience varies for customers depending upon their service types, available data, costs, and locale. Note that the following list indicates the primary user experience variations, not all possible variations.
Solar Report
- Net energy: The term 'energy use' is replaced with 'net energy.'
Progress Report, Limited Income Report, Time of Use Report
- Benchmark State: The copy below the gauge changes depending on the customer's current state and any differences since their last report. Possible states include:
- Fair state: Explains how to use the report.
- Good state: Explains how to use the report.
- Great state: Congratulates the customer for being efficient.
- High to lower use state: Congratulates the customer for lowering their use compared to neighbors.
- Low to higher use state: Helps the customer consider what may have changed.
- Fuel Type: The customer's fuel type is displayed in the header and benchmark copy, "Your <fuel variation> use at a glance."
- Gas-only: The benchmark header and copy use the term 'gas.'
- Electric-only: The benchmark header uses the term 'electricity' and the benchmark copy uses the term 'energy.'
- Dual fuel: The benchmark header and copy use the term 'energy.'