View Menu
Options available here provide different views of the electrical network:
• Color by Feeder: When selected, colors the network feeder by feeder.
• Color by Phase: When selected, colors the network by phase.
• Color by Nominal Voltage: When selected, colors the network by nominal voltage.
• Color by Voltage Per Unit: When selected, colors the network by voltage per unit (that is, the per unit voltage range).
Only available when Power Analysis is enabled on the system) <link to Viewer Power Flow Information Visualization, Viewer Power Flow Information>
• Color by Current: When selected, colors the network by the current range.
Note: Only available when Power Flow is enabled on the system. See Viewer Power Flow Information Visualization for information.
• Color by Loading: When selected, colors the network by load (that is, the per unit current range).
Note: Only available when Power Flow is enabled on the system. See Viewer Power Flow Information Visualization for information.
• Color by Limits: When selected, colors the network by amp limits.
Note: Only available when Power Flow is enabled on the system. See Viewer Power Flow Information Visualization for information.
• Color Secondary by Fixed Color: When selected, all secondary network will show with the configured fixed secondary color.
• Color Secondary by State: When selected, secondary networks that have state related styles will be styled according to the state. Any secondary network that is in a nominal state will show the configured fixed secondary color.
• Color Secondary by State and Mode: Similar to the Color Secondary by State option, but the nominal state conductors will follow the Feeder/Phase/Voltage coloring mode, just like non-secondary conductors.
• Show Nominal Network State: When selected, displays the nominal state of devices and conductors.
• Declutter Symbols: When selected, declutters the network when zoomed out.
• Hide Conditions With Devices: When selected, conditions will be hidden when their associated device is decluttered from view. Some configurable classes of condition will always show regardless of the value of this setting (for example, certain types of event).
• Show Diagnostics Panel: Displays a panel allowing access to Map configuration and analysis (not displayed for most User types).
Map Hide/Display Options
The Hide/Display panel allows you to select what devices or map components to show or hide. Select the Hide/Display toolbar button [1] to open the panel [2]. See Hiding and Displaying Viewer Objects for more information.
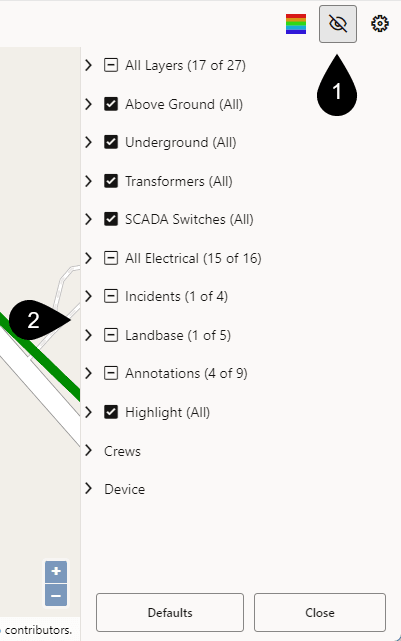
You can also press Ctrl+Shift+F to open the panel.
The panel is broken down into a number of collapsible sections, with each section containing a number of check‑boxes or radio buttons that control which objects and conditions should be shown on the map. Most of the sections consist entirely of check‑boxes, and for these the entire section can be toggled on/off even when the section is collapsed, using the check‑box in the section's title bar.
The sections represent conceptual groupings of object types and so can have overlapping contents where the same item belongs to several groups, for example "Network Transformers" can be found under "All Layers", "Underground", "Transformers" and "All Electrical". This allows entire groups of related object types to be toggled on/off with a single action.
The settings in this panel can be restored to their configured default values at any time using the "Defaults" button at the bottom of the panel.
The standard product configuration provides the following sections:
• All Layers: This section contains all of the layer based filters.
• Landbase: Toggle the visibility of the landbase (if one is selected in the Settings panel).
• Overhead Conductors: Toggles the visibility of overhead conductors.
• Underground Cables: Toggles the visibility of underground cables.
• Underground Fuses: Toggles the visibility of underground fuses.
• Secondary: Toggles the visibility of the secondary network.
• SCADA Disconnects: Toggles the visibility of SCADA disconnects.
• SCADA Circuit Breakers: Toggles the visibility of SCADA circuit breakers.
• Other SCADA: Toggles the visibility of other SCADA map components which do not have a specific toggle.
• Overhead Transformers: Toggles the visibility of overhead transformers.
• Substation Transformers: Toggles the visibility of substation transformers.
• Network Transformers: Toggles the visibility of network transformers.
• Padmount Transformers: Toggles the visibility of padmount transformers.
• Elbows: Toggles the visibility of elbows.
• Other Electrical: Toggles the visibility of other electrical map components which do not have a specific toggle.
• Supply Nodes: Toggles the visibility of supply nodes.
• Structures: Toggles the visibility of structures such as poles.
• Manholes: Toggles the visibility of manholes.
• Roads: Toggles the visibility of roads modeled in NMS.
• Street Intersections: Toggles the visibility of street intersections modeled in NMS.
• Waterways: Toggles the visibility of waterways modeled in NMS.
• Other Landbase: Toggles the visibility of other landbase elements modeled in NMS that do not have a specific toggle.
• Measurements: Toggles the visibility of digital and analog SCADA measurements.
• Limits: Toggles the visibility of limit data if the Measurements option is selected.
• Show All Calls: Toggles the visibility of all customer calls.
• Show All AMI: Toggles the visibility of all AMI‑related conditions.
• Show FLA By Default: Toggles the visibility of all FLA‑related conditions.
• Show All Damage: Toggles the visibility of damage assessments on devices that are not the main asset of the damage assessment.
• Above Ground: A subset of the "All Layers" section.
• Underground: A subset of the "All Layers" section.
• Transformers: A subset of the "All Layers" section.
• SCADA Switches: A subset of the "All Layers" section.
• All Electrical: A subset of the "All Layers" section.
• Incidents: A subset of the "All Layers" section.
• Landbase: A subset of the "All Layers" section.
• Annotations: Controls the display of various annotations such as labels.
• Conductor Current Phase Markers: Toggles the visibility of the current phase markers on conductors. These indicate the current phase of the conductor using a colored indicator with the colors indicating the phases. Either a single dot for single phase, a circle with 2 colored halves for 2 phase conductors, or a circle broken into 3 colored sections for 3 phase conductors. These will be placed at intervals along the conductors so the phase can be easily determined.
• Measurements: Toggles the visibility of digital and analog SCADA measurements.
• Condition Labels: Toggles the visibility of labels on certain types of condition, for example events or crews.
• Device Labels: Toggles the visibility of device labels.
• Device Nominal Phase Labels: Toggles the visibility of nominal phase labeling on devices - this indicates the nominal phases and their current energized state, with color highlighting when the phase is in an abnormal state.
• Conductor Nominal Phase Labels: Same as above for conductors.
• Conductor Feeder Labels: Toggles the visibility of labels on conductors which indicate their nominal feeder.
• Flow Direction: Toggles the visibility of electrical flow direction arrows on conductors. This will use power flow analysis if it is enabled on the system.
• Highlight: These options toggle the visibility of highlights on devices and conductors.
• Predicted De-energized: adds a glow around primary conductors that are predicted to be de-energized.
• Predicted Secondary De-energized: adds a glow around secondary conductors that are predicted to be de-energized.
• Confirmed De-energized: adds a glow around primary conductors that are confirmed to be de-energized.
• Confirmed Secondary De-energized: adds a glow around secondary conductors that are confirmed to be de-energized.
• Confirmed Degraded: adds a glow around primary conductors that are confirmed to be degraded.
• Confirmed Secondary Degraded: adds a glow around secondary conductors that are confirmed to be degraded.
• Distributed Generation: adds a glow around conductors fed (or partially fed) by distributed generation.
• Powerflow Violations: adds a glow around devices or conductors that have a power flow violation.
• Powerflow Warnings: adds a glow around devices or conductors that have a power flow warning.
• Voltage Angle Violations: adds a glow around devices or conductors that have a voltage angle violation.
• Assessed: adds a glow around conductors that have been marked as assessed.
• Crews: Controls the visibility of crew symbols.
• Assigned Crews: Controls the visibility of the assigned crews.
• Crew Types: Toggles the visibility of the different crew types configured in the system, for example "Tree Crew" or "Line".
• Device: Options related to device characteristics.
• Network Level: Allows the user to choose between "All Primary", "Backbone and Laterals", "Backbone Only", "SCADA Only" and "Primary and Secondary".
• Phases: Allows the user to choose between "All", "3-Phase Only" and "Multi-Phase".
• Pending Devices: Allows the user to choose to display construction pending, decommissioning conditions and inactive devices.
Note that the Roads, Street Intersections, Waterways, and Other Landbase options toggle visibility of these elements which have been modeled in NMS, not those provided as part of the geographic map landbase.
Using the Map's Back and Forward Buttons
The map toolbar Back ( ) and Forward (
 ) buttons allow you to go back or forward to recently viewed positions on the map. The history is stored whenever the Map is stationary for a couple of seconds. Up to 50 map positions can be stored in history.
) and Forward () buttons allow you to go back or forward to recently viewed positions on the map. The history is stored whenever the Map is stationary for a couple of seconds. Up to 50 map positions can be stored in history.When smooth animation between positions is enabled, there may be some occasions where you want to skip the animation and proceed directly to the target. Selecting the skip animation option ( ) performs that action.
) performs that action.Note: Alternatively, to skip the animation, you can press G on your keyboard.
Searching and Positioning
You can search on assets, customers, and other type of map object.
1. Click the Search button ( ) to open the Map Search dialog box.
) to open the Map Search dialog box.2. Choose the Search Type from the drop‑down list.
3. Enter the text to search for.
4. Select a wildcard option, if applicable.
5. Click the Search button to execute the search:
Search button to execute the search:• If there is only one match, the dialog box will close and the Map will reposition.
• If there are multiple matches, they will be displayed in the Search Results panel that is displayed below the map. If the search result exactly matched the entered text, it will be highlighted and positioned automatically.
Using the Distance Measurement Tool
You can measure distances on the Map:
1. In the Map toolbar, click the tool selector drop‑down () then select the measurement tool () from the available options.
2. Click in the map to add a start position.
3. Move to a different position and click again to create a turning point.
4. Double-click or click on the last point to complete the measurement. The distance is displayed in the top-right corner of the Map.
5. Click anywhere in the Map to remove the measurement.
Using the Geographic Location Tool
You can click on a map location to get the geographic co-ordinates:
1. In the Map toolbar, click the tool selector drop‑down ( ) then select the Select a Geographic Location (
 ) option from the available options.
) then select the Select a Geographic Location () option from the available options.2. Click in the Map at the desired location. The geographic co-ordinates are displayed in the top-right corner of the Map.
3. If required, copy the co-ordinates to the clipboard.
4. Click anywhere in the Map to remove the co-ordinates.
Displaying Tooltips
You can display hover-over tooltips:
1. In the Map toolbar, click the tooltip button ( ).
).
).2. Mouse over a device, conductor, or symbol to reveal more information.
To keep the tooltip displayed, move the mouse pointer over the tooltip while it is still displayed. The information displayed depends on the type of object.
Displaying Device Details
The Flex Operations Device Details balloon displays the same information available in the Java Viewer (see Displaying Device Details). Device Details can be shown by clicking the Details Balloon button ( ) on the toolbar or Selection Panel. You can also enter a mode where each click shows the details balloon using the Show Balloons () option under the tool selector drop-down (
 ).
).
) on the toolbar or Selection Panel. You can also enter a mode where each click shows the details balloon using the Show Balloons () option under the tool selector drop-down ().Selecting and Interacting with Map Objects using the Selection Panel
When you select a device or symbol, it will be highlighted or outlined in yellow [1]. The Selection Panel will be displayed [2] when the Selection Panel icon is toggled on [3]. Device operations are available through right-click context menus [4].
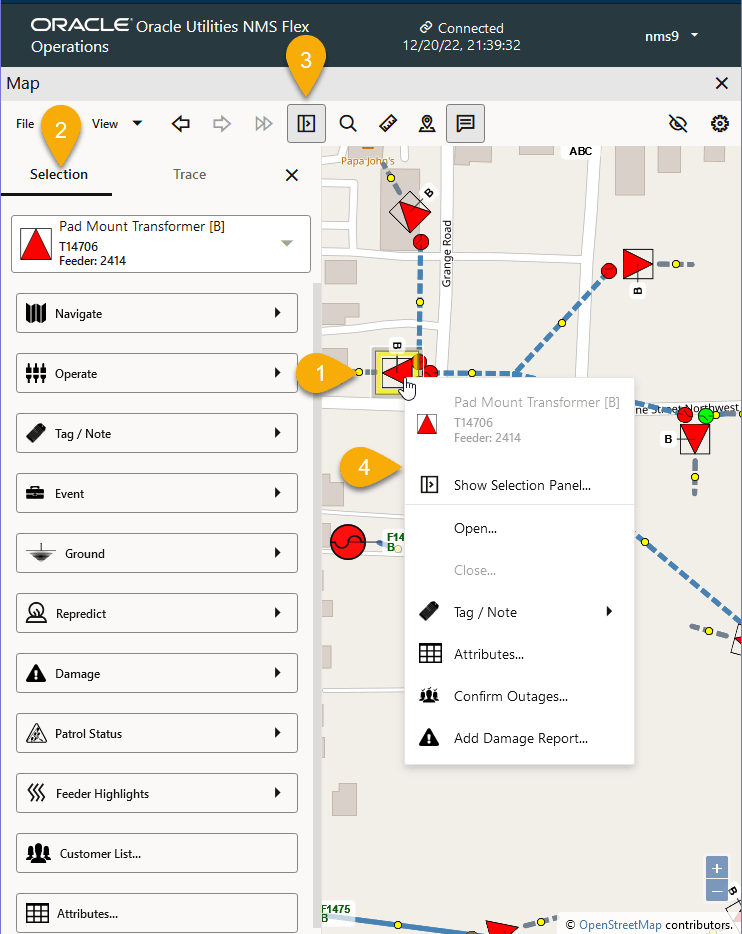
The Selection Panel is a combination tool providing actions and information that are found in multiple tools in the NMS operations client (for example, the Control Tool).