Using the Viewer
The Viewer presents a graphical representation of the distribution system, with additional symbology for conditions such as outages, crew locations, notes, tags, and so on. The Viewer dynamically updates with condition and distribution changes.
This section includes the following topics:
Starting the Viewer
To open a Viewer, select the Viewer 1... option on the Web Workspace Tools menu. To start a second Viewer, select Viewer 2... After you have opened the Viewer, selecting the menu option will change the focus to that Viewer.
Understanding the Viewer
The following diagram shows the functional areas of the Viewer: 
Viewer Functional Areas Legend:
Understanding the Viewer Drawing Area
The Viewer's drawing area displays dynamic maps that reflect the status of the system. The lines (used to represent conductors) and the icons (used to represent devices and conditions) are called symbols; the conventions that govern symbols are referred to as symbology.
Certain condition symbols, such as event type or note indicator, provide tooltips indicating the symbol's meaning. For example, as shown in the illustration above, the Note symbol's hover text is Operator Note.
If configured, the Viewer will dim the parts of the model that are outside of the user's authority. In those sections, the user will not be able to operate or otherwise modify those devices without taking authority using the Authority tool (see Taking Authority for Control Zones).
Understanding the Viewer Message Area
The Viewer's message area displays device aliases, feeder names, and substation names.
Using the Viewer Menus and Toolbar
The Viewer's menus and toolbars provide access to common functions.
File Menu
Option | Description | Toolbar Button |
|---|---|---|
Print | Opens the Print Preview window, which allows you to print the contents of the Viewer window. | |
Exit | Exits the Viewer. | -- |
Actions Menu
Option | Description | Toolbar Button |
|---|---|---|
Focus | Focuses the Viewer on selected devices or devices associated with selected events. See Viewer Focus for details. | |
Back | Moves to the previous view before a pan, zoom, or object focus operation (if any) changed the focus location in the Viewer. This button functions similarly to a web browser back button, storing a dozen "views." However, the loaded maps, the hide/display layers, and other options will use the current settings. | |
Forward | Moves to the next view if the Back button has been used. It functions similarly to a web browser's forward button. However, the loaded maps, the hide/display layers, and other options will use the current settings. | |
Search | Opens the Search dialog box, which allows you to enter search criteria and execute a search in the Viewer. | |
Load Maps | Allows you to explicitly load additional maps to display more of the surrounding area or additional detail. | |
Unload Maps | Unloads all maps, not just those in the visible drawing area. | |
Save View Area... | Saves the viewing area after prompting for a name for the saved area. If a view area already exists with that name, you will be asked if you want to replace it. | |
Delete View Area... | Deletes the viewing area after prompting for confirmation. | -- |
Show Lens | Opens a Lens window zoomed in on selected device. See Using Lens Windows. | -- |
Feeder Focus | Shows the selected device's feeder at a zoom level that will allow the Viewer to display the feeder in its entirety. | -- |
Change Focus Feeders... | Opens the Select Feeders to Display dialog that lists the feeder in focus and all adjacent feeders allowing you to select (or deselect) which feeders to view in Feeder Focus. Feeder Focus on Adjacent Feeders. | -- |
Feeder One Line | View the feeder one line for the selected object. | |
Schematic Diagram | Focus the Viewer on the selected device or associated selected events in the schematic view is available. | |
View Browser Map | Opens a web browser map to display the geographic area. | |
Focus on Feeder Breaker | Focuses the Viewer window on a breaker currently feeding the selected device. If the device is deenergized, the nominal breaker will display. | |
Hide/Display... | Opens the Hide / Display dialog box, which allows you to select what information will be displayed on the map. See Hiding and Displaying Viewer Objects. | |
Toggle Landbase | Turns the background landbase map on or off. | -- |
Toggle SCADA View | Removes all non‑essential devices to only show the feeder backbones and SCADA devices. The device classes that are shown in this view can be configured on a project basis and tuned as needed. | |
Feeder Names | Causes the right status bar to display the names of the feeders and substations feeding the selected device for parallel or meshed conditions; for tie points, it will display the names of both feeders. | -- |
Pointer Coordinates... | Opens a dialog box that displays the geographic coordinates for a selected object. | -- |
Group Events... | Opens the Group Events dialog box, which allows you to manually merge, relate, and un-relate events. | -- |
Navigate Menu
The Navigate menu lists the Viewer's navigation keyboard shortcuts and allows you to select whether the Viewer's Pan and Zoom Control is displayed in the Viewer Drawing Area. Navigation keyboard shortcuts use the keyboard arrow keys and the numeric keypad plus (+) and minus (-) keys (not the keyboard's number row).
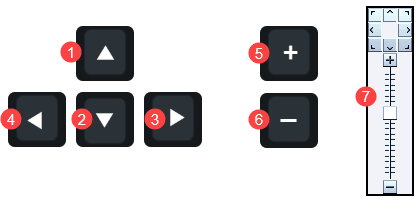
# | Option | Description | Keyboard Shortcut |
|---|---|---|---|
1 | North | Moves the map to the north. | Up |
2 | South | Moves the map to the south. | Down |
3 | East | Moves the map to the east. | Right |
4 | West | Moves the map to the west. | Left |
5 | Zoom In | Zooms in on the map to show a smaller area in more detail. | Plus |
6 | Zoom Out | Zooms out on the map to show a larger area. | Minus |
7 | Show Pan and Zoom Control | Check‑box allows you to select to display the Viewer Pan and Zoom control; deselect to hide the control. | -- |
Settings Menu
Option | Description | Toolbar Button |
|---|---|---|
Fixed Size | This mode will keep the symbol and text sizes the same regardless of the zoom level. | -- |
Text Bigger | Increases the text font size. | |
Text Smaller | Decreases the text font size. | |
Symbols Bigger | Increases the size of symbols. | |
Symbols Smaller | Decreases the size of symbols. | |
Attributes Farther | Displays attributes (for example, flags, note symbols, and so on) away from the device. Each subsequent action moves the attribute farther away. | -- |
Attributes Closer | Displays attributes closer to the device. | -- |
Reset Scale | Resets the size of symbols and text to its default size. | |
Unload Maps on Map Load | Selection that sets the Viewer to unload previously loaded maps before loading another map. | -- |
Tools Menu
Option | Description | Toolbar Button |
|---|---|---|
Commissioning Tool | Opens the Commissioning Tool. See Using the Commissioning Tool. | |
Assessment Tool... | Opens the Assessment Tool. See Using the Assessment Tool. | |
Feeder Load Management... | Opens the Feeder Load Management window. See Feeder Load Management. | |
Suggested Switching... | Displays the Suggested Switching wizard. This option is only enabled if a device is currently selected in the Viewer. See Using the Suggested Switching Tool. | -- |
Optimization... | Displays the Optimization wizard. This option is only enabled if a device is currently selected in the Viewer. See Chapter 16, Network Optimization Tool for information. | -- |
Options Menu
Option | Description | Toolbar Button |
|---|---|---|
Use CNV | Toggles between the legacy Viewer and the Common Network Viewer, which is also available in the Operations Mobile Application and in Flex Operations. | |
View Phases | Sets the Viewer's drawing areas to show conductor coloring by phases. | -- |
View Feeders | Sets the Viewer drawing area to feeder coloring mode. | -- |
View Currents | Sets the Viewer's drawing areas to show coloring by the current range. See Chapter 13, Viewer Power Flow Information Visualization, for more information. | -- |
View Loading | Sets the Viewer's drawing areas to show coloring by load (that is, the per unit current range). See Viewer Power Flow Information Visualization, Viewer Power Flow Information Visualization, for more information. | -- |
View Voltage Per Unit | Sets the Viewer's drawing areas to show coloring by voltage per unit (that is, the per unit voltage range). See Chapter 13, Viewer Power Flow Information Visualization, for more information. | -- |
View Nominal Voltages | Sets the Viewer's drawing areas to show coloring by the nominal voltage range. See Chapter 13, Viewer Power Flow Information Visualization, for more information. | -- |
View Limits | Sets the Viewer's drawing areas to show conductor coloring by their Amp limits. | |
Show Flow Direction | Overlays flow direction arrows the selected view option. See Chapter 13, Flow Direction, for more information. | -- |
Big Symbols | Allows you to toggle the display of Big Symbols, which are enlarged versions of normal symbology that allow you to see certain device types and conditions when zoomed out. In the following image, Big Symbols are active in the top view and inactive in the bottom view.  | -- |
Show PF Options | Toggles the display of study session parameters in the Viewer when in study mode. See Viewing and Modifying Study Session Parameters for more information. | -- |
Real Time | If you are currently in Study mode, select this to switch to real-time mode. If you are currently in real-time mode, this is grayed out. For more information on real-time mode, see Real-Time and Study Mode. | |
Study | If you are currently in real-time mode, select this to switch to Study mode. If you are currently in Study mode, this is grayed out. For more information on study mode, see Real-Time and Study Mode. | |
Study Mode | Reset to Real-Time: reset the study session to the current real-time model. | |
Reset to Nominal: reset the study session to the nominal model. | ||
Reset...: displays the Reset Study Session dialog, which allows you to reset your session, and, optionally, add or remove DMS for it. | ||
Save Case Management...: opens the Save Case Management tool, which allows you to view, modify, delete, or reset to session changes. See Using the Save Case Management Tool for more information. | ||
Close Study Session: closes the study session and returns the Viewer to real-time mode. | ||
DMS in Study Session | This option allows users to enable DMS tools before starting their next study session. These users can also close their sessions and re-initialize them to change the DMS in Study Session option. Users with DMS_STUDY_MODE permission will notice that the DMS in Study Mode check‑box is checked by default. | |
Power Flow Real-Time Options... | The Power Flow Options button opens the Power Flow Options dialog box. |
Help Menu
Option | Description | Toolbar Button |
|---|---|---|
Viewer Help | Opens online help content for the Viewer. | -- |
Color Legend | Opens the Color Legend window, which displays information about symbology coloring. See Understanding Viewer Coloring for more information. | -- |
Highlight Legend | Opens the Highlight Legend window, which displays information about the current view. See Understanding Viewer Coloring for more information. |
Additional Viewer Toolbar Options
The following toolbar options do not have corresponding menu options:
Option | Description |
|---|---|
The Control Tool button opens the Control Tool for the selected device. The Control Tool may also be opened by double-clicking a device or by right clicking the device and selecting Control Tool... from the context menu. (See Using the Control Tool.) | |
The Trace button opens the Trace tool window, set to the current device. The Trace tool may also be started by right clicking the device and selecting Trace... from the context menu. (See Executing Traces.) | |
The Supply Points Mode button causes the Viewer to display supply points for potential selection. This allows supply points to be graphically grouped and added to an outage. | |
The Device Details button toggles device details on or off. Device Details may also be toggled on or off by right clicking the device and selecting Device Details... from the context menu. (See Displaying Device Details.) |
Saving Viewer Preferences
When you have adjusted the Viewer options to render symbols, text, and window information as desired, you may select Save Preferences from the Web Workspace User menu's Manage Preferences submenu to save the options for subsequent sessions.
Understanding Viewer Tooltips
When you hover over a crew, an event, a device, or a condition, a tooltip will appear. This tooltip displays characteristics of the crew, event, device, or condition, such as the crew name, type, event number, etc. Move your mouse over the tooltip to keep it visible. Otherwise, it will disappear after a few seconds.
Understanding Viewer Context Menu Options
When you select certain objects in the Viewer and right-click, a context menu will display a list of options available for the object.
Crew Context Menu Options
The following options are displayed when you right-click a crew symbol in the Viewer window; these options are only available for crews with AVL (Automatic Vehicle Location) systems.
Menu Option | Description |
|---|---|
Assign | Assigns the crew selected in the Viewer to the event currently selected in Work Agenda. See Assigning a Crew to an Event for more information. |
En Route | Puts the crew selected in the Viewer en route to the event currently selected in Work Agenda. This is enabled only if the selected crew is an on-shift, available, non-mobile crew that is not currently en route or onsite. See Placing a Crew En Route for more information. |
Onsite | Puts the crew selected in the Viewer onsite at the event currently selected in Work Agenda. This is enabled only if the selected crew is en route. |
Offsite | Puts the crew selected in the Viewer offsite; this is available only if the crew is onsite. |
Release Crew | Releases the crew selected in the Viewer from the en route/onsite event selected in the Work Agenda. See Releasing Crews from an Event for more information. |
Update Availability... | Opens the Update Crew Availability dialog box for the selected crew. See Changing Crew Availability for more information. |
Crew Info... | Opens the Crew Info dialog box for the selected crew. See Using Crew Info for more information. |
Event Options
The following options are displayed when you select an event symbol and right-click to open the context menu:
Menu Option | Description |
|---|---|
Event Details... | Opens the Event Details window for the event. See Understanding Event Details. |
Trouble Info... | Opens the Event Details Trouble Info tab for the event. See Using the Trouble Info Tab. |
Event Log... | Opens the Event Details Event Log tab for the event. See Using the Event Log Tab. |
Damage Assessments... | Opens the Event Details Damage Assessments tab. See Using the Damage Assessments Tab. |
Show Fault Locations | Shows the fault locations for the selected event. |
Hide Fault Locations | Hides all potential fault locations for the selected event. |
Crew Info... | Opens the Crew Info window for the crew assigned to the selected event. See Using Crew Info. |
Show En Route Location... | Shows the AVL location of the crew that is currently en route to the selected event. This option is only enabled when one crew is assigned to the event. |
Release Crews... | Opens the Release Crews dialog box. Enabled when one or more crew is assigned to the event. See Releasing a Crew from the Crew Symbol in the Viewer. |
Make Predicted Stable | Makes currently selected predicted outage stable. Visible only when currently selected predicted outage can be made stable. See the Working with Stable Predictions for more details. |
Remove Predicted Stable | Removes stable flag from the currently selected predicted stable outage. Visible only when a predicted stable outage is selected. See the Working with Stable Predictions for more details. |
View Place Condition Step... | The View Place Condition Step... option is for tags, notes, and ground symbols. It opens the Switching Sheet, Safety Document, or Miscellaneous log file entry that created this symbol. |
Condition Placement Options
Condition sizing and locations can be adjusted by an administrator; non-administrators can move conditions temporarily during their session. For conditions, moving a condition affects any conditions at a device position, including future conditions for that device. Measures and conditions may be moved.
Menu Option | Description |
|---|---|
Move | Moves a condition to a new location. If there are multiple conditions at a location, only the condition closest to the device can be moved. |
Show Leader Line | Shows the leader line for the device. |
Hide Leader Line | Hides the leader line. |
Reset Location | Resets the condition position to the default location. |
Rotate Clockwise | Rotates the symbol clockwise (only available for measurements). |
Rotate Counterclockwise | Rotates the symbol counterclockwise (only available for measurements). |
Resize Bigger | Increases the symbol size (only available for measurements). |
Resize Smaller | Reduces the symbol size (only available for measurements). |
Device Options
Depending on the device type, the following options may be displayed when you select a device and right-click to open the context menu:
Menu Option | Description |
|---|---|
Control Tool... | Opens the Control Tool for the selected device. See Using the Control Tool. |
Device Details... | Displays the Device Details balloon above the selected device. See Displaying Device Details. |
Attributes... | Opens the Attributes window, which displays information about the selected device. See Viewing Device Attribute Information from the Viewer. |
Open... | Initiates the Control Tool's Open command. See Control Tool Actions. |
Close... | Initiates the Control Tool's Open command, if applicable. See Control Tool Actions. |
Customer List... | Displays the Event Details Trouble Info tab's Customers List view. See Using the Trouble Info Customers View for more information. |
Damage Assessments... | Opens the Event Details Damage Assessments tab, which displays a list of damage assessments associated with the device and allows you to add new damage assessments. See Using the Damage Assessments Tab. |
Quarantine | Add a quarantine assessment condition. See Assessment.... |
Start Patrolling | Add a Start Patrolling assessment condition. See Assessment.... |
Remove Assessment | Remove the assessment condition. See |
Focus on Feeder Breaker | Focuses the Viewer window on a breaker currently feeding the selected device. If the device is deenergized, the nominal breaker will display. |
Generate Tag Steps | Allows you to generate a set of steps in the active switch sheet to tag devices upstream from the selected device. These will appear in a new Place Tags steps block. |
Toggle Call Display | Toggles call display on or off. When enabled, a symbol is displayed in the Viewer window for any devices that have calls associated with an event. Events with calls and clues will show the call symbol and clue symbol.  |
Trace... | Opens the Trace tool, which allows you to display the path from a selected device to other devices based on specific criteria. See Executing Traces. |
Using the Legacy Viewer and the Common Network Viewer
There are two types of Viewers available in the Web Workspace. The first is the legacy Viewer that provides full functionality of the system; the second Viewer is a newer Common Network Viewer (CNV), which is also used by Flex Operations and Operations Mobile application.
Note: Future versions of the Web Workspace will only support the CNV.
To switch between the Viewers, select Use CNV from the Viewer's Options menu. You can toggle between the two on different Viewers independently.
The CNV currently supports most of the Legacy Viewer's functionality, but there are a few limitations. The following functional items are not currently available on the CNV:
• Lenses
• Moving conditions. (Though if conditions are moved, they will display correctly in CNV.)
• Toggle Call display (from the Control Tool).
• Outage summary display.
• Dragging a crew to a different location.
Displaying Device Details
Device Details provides information about devices selected in the Viewer. In the legacy viewer, Device Details is enabled by clicking the Device Details button ( ) in the Viewer's toolbar or by right-clicking a device and selecting Device Details... from the context menu.
) in the Viewer's toolbar or by right-clicking a device and selecting Device Details... from the context menu.In CNV mode, you can show the device details by selecting it, then clicking the Device Details button ( ) in the Viewer's toolbar or by right clicking a device and selecting Device Details... from the context menu.
) in the Viewer's toolbar or by right clicking a device and selecting Device Details... from the context menu.You can also enter the legacy Viewer mode where every time you click a device, its details are shown, by choosing Show Balloons from the Options menu's Selection Mode sub-menu.
 (
(Note: The Viewer's Device Details button is highlighted when enabled.
When Device Details is enabled, selecting a device will automatically launch a balloon-style callout window attached to the device in the Viewer. Selecting a different device will close the first window and open a window for the newly selected device. To keep a window open, you may pin it by clicking the pin button ( ). You may unpin the window by clicking the unpin button (
 ) or close it by clicking the close button (). Device Details windows may be dragged to a different location in the Viewer or resized.
). You may unpin the window by clicking the unpin button () or close it by clicking the close button (). Device Details windows may be dragged to a different location in the Viewer or resized.The Device Details tabbed data views provide relevant information based on the object selected. Data is refreshed whenever you select a different tab, but you may manually refresh the data by clicking the refresh button (). Click the Help button () to display help for the active tab.
The Device Details tabs provide the following information:
Device Info: The information contained in the Device Info tab varies depending on the type of device and its current condition, but may include the following types of information:
• Event information, such as number of customers affected, when the event began, estimated restoration time, event type, event number
• Event Note
• Location
• Device Notes
• Crew information
• SCADA: The SCADA tab displays SCADA device data. It is only enabled for SCADA devices in systems that have implemented SCADA Extensions; see Displaying SCADA Measurements with Asset Details for details.
• Power Flow Results: The Power Flow Results tab displays Power Flow calculation results. It is only enabled in systems that have implemented Power Flow Extensions; see Understanding the Device Details Power Flow Results Data Table for details.
• Connected kVA Results: The Connected kVA Results tab displays connected kVA for de-energized devices. The kVA is calculated based on downstream devices in nominal session. The tab is visible only when the selected device is de-energized.
• Fault Details: The Fault Details tab shows fault currents at the selected point in the model. Depending on the conductor selected, data will be displayed for the following fault types:
• Single Phase Fault
• Line to Line Fault
• Three Phase Fault
• Regulation Settings: The Regulation Settings tab displays power engineering information for regulation devices, such as shunt capacitors, reactors, regulators/substation transformers, sources, and distribution generators. The information displayed in the Regulation Settings tab varies by regulation device type.
• Shunt Devices
• On Threshold
• Off Threshold
• Position
Note: The Position will state either "on" or "off" depending on the state of the capacitor. When "off," the device will show as being open in the NMS model.
• Automatic Control
• Regulation Type
• Measurement Type
• Operations Count
• Operations Count Threshold
• Local Voltage Control (Good Value)
• Generators
• Voltage
• Angle
• Distribution Generators
• kW
• kVAr
• Voltage Setpoint
• Voltage Regulation
• Status
• Charge Mode
• TTL Expiration
• Wind Speed
Note: The wind speed of the Distributed Energy Resource’s (DER) zone. For a wind DER, it will show the speed of its zone; for other DERs, it will show as N/A.
• Regulator/Transformer
• Voltage Setpoint
Note: If the device is configured for un‑ganged regulation each independent phase specific voltage setpoint will be displayed in this column. For devices that are configured for ganged regulation a single setpoint will be displayed.
• Tap Step
Note: If the device is configured for un‑ganged regulation each independent phase specific tap position will be displayed in this column. For devices that are configured for ganged regulation a single tap position will be displayed.
• Min Tap Step
• Max Tap Step
• LD Comp Z
Note: Represents the line drop compensation settings that are configured for the regulator or transformer.
• Tap Side
• Automatic Control
• Violations: The Violations tab shows a list of violations and warnings at the selected point in the model.
Note: The Violations tab's percent (%) column displays device violations and warnings, which are the same as power flow violations.
• Voltage and current violations are highlighted in red.
• Voltage and current warnings are highlighted in yellow.
• Amps for back-feeds are highlighted in gray.
The Violation column in Violation tab shows only feeder violations.
• DMS Settings: The DMS Settings tab displays DMS settings for the feeder that the device is on; the settings are configured using the Configuration Assistant Feeder Management tab (see for information). The DMS Settings tab includes the following information:
• Substation
• Feeder
• PF Mode (hidden by default)
• FLISR
• FLM
• FLA
• Optimization
• Optimization Objective
• Protection Schemes
• Protection Schemes Mode
• Feeder Type (hidden by default)
Note: See Understanding Column Display Options for information on unhiding and hiding table columns.
Viewing Device Attribute Information from the Viewer
You can access attribute information related to a device using the Viewer. Device attributes include physical and reference information about a device, such as location and rating.
To view device attributes from the Viewer, complete these steps:
1. Right-click a device in the Viewer.
2. From the context menu, click Attributes…. The Attributes window opens as a dockable pane in the Viewer.
About the Attributes Window
The Attributes window is tabular and allows standard sorting and filtering.
The information in the Device Information is view-only. Once the device attribute window is open, selecting another device in the Viewer will update the information for the selected device.
Understanding Viewer Coloring
When the Viewer is launched, the network model is displayed with Feeder coloring where all conductors fed from a feeder are displayed in the same color. Conditions affecting the network are displayed with highlight coloring, which overlays a glow on the affected network component.
Note: Deenergized highlighting will only appear when customers are affected.
Changing the Coloring Mode
When the Viewer is launched, the network model is displayed in Feeder view where all conductors fed by a feeder are displayed with the same color.
Note: The view indicator is displayed in the Viewer's status bar next to the Real-Time/Study Mode indicator.
To change to a different view, select the view from the Viewer's Options menu (see Options Menu for details on the different view options). For example, to change to the Phase coloring mode, select View Phases from the Viewer Options menu.
Viewing the Color Legend
To see the color legend for the view, select Color Legend... from the Viewer Help menu.
Viewing the Highlight Legend
To see the highlight legend for the view, select Color Legend... from the Viewer Help menu.
Note: De-energized highlighting will only appear when customers are affected.
Searching and Loading Viewer Maps
The Viewer Search functionality allows you to quickly focus the Viewer on an area or object.
• Search Type Option • Search Case Option • Search Result Limit • Customer Information Section • Account # • Name • Address • Telephone • Meter Number • Intersection • Street 1 • Street 2 • Substation Name • Feeder Name • Device ID • View Area • Crew ID • Event # |  |
Using the Search Tool to Locate Map Areas and Objects
To locate a particular area or object in the Viewer, complete these steps:
1. Click the Search button on the Viewer toolbar or from the Actions menu. The Search dialog box opens.
2. Select the Search Type you wish to perform (Exact Match, Wildcard Before, Wildcard After, Wildcard Before and After, Soundex) from the Search Type option menu.
3. Select the Search Case option you wish to use (Case Insensitive, Case Sensitive) from the Search Case option menu.
4. Enter your search result limit in the Search Result Limit field (default value is 100).
5. Click the desired search field and either enter search criteria or leave the field blank to return all possible values (up to the search result limit).
6. Press ENTER or click the Search button.
7. If there is only one match, the Viewer will shift focus to the search result. If there are multiple matches, a Search Results dialog box displays the search results and the Search dialog box closes.
For example, an Intersection search using the term Oaklynn returns six matches.

8. If there are multiple matches, select a row in the Search Results dialog box and click the OK button. The object appears centered in the Viewer and the Search Results dialog box closes.
Note: If none of the results are what you wanted, click Cancel in the Search Results dialog box. The Search Results dialog box closes and the Search dialog box is redisplayed.
Loading and Unloading Viewer Maps
Once you have located an area or object using the Search dialog box, you can navigate to an adjacent area where the maps are not yet loaded. From here, you can load all the maps that should appear in the drawing area.
To load maps, do one of the following:
• Select Load Maps from the Actions menu.
• Press the M key.
• Click the Load Maps button () on the toolbar.
To unload all maps (not just those in the visible drawing area), do one of the following:
• Select Unload Maps from the Actions menu.
• Press Shift+U.
• Click the Unload Maps button ()on the toolbar.
Note: Unless your system is configured to unload maps with each focus, any loaded maps will continue to be loaded until you explicitly unload maps or you switch mode (that is, from study to real-time or from real-time to study).
If there are more devices displayed than the configured maximum, which is 500,000 in the product configuration, the viewer will unload the maps that have the oldest access time to get the total under the limit.
Navigating in the Viewer
There are a number of ways to navigate (pan and zoom) in the Viewer drawing area:
• Use keyboard shortcuts. See Navigate Menu for the available keyboard shortcuts.
• Use the Pan and Zoom Control. You can show or hide the control by selecting or deselecting, respectively, the Navigate menu's Show Pan and Zoom Control check‑box.
• Pan left, right, up, down, or diagonally in the map using the pan compass.
• Use the Plus (+) and Minus (-) buttons on the zoom slider to zoom in and out. You can also drag the zoom slider toward the + to zoom in or toward the - to zoom out. The scale indicator displays the current zoom scale. The scale is hidden if a schematic view, such as a substation, is selected.
• Navigate using your mouse controls, as described in the next section.
Navigating Using Mouse Controls
There are various mouse controls you can use to navigate within the Viewer. The following table shows the Viewer's mouse commands.
To… | Do this… |
|---|---|
Select an object | Click the object. |
Select multiple objects | Shift-click and drag to extend the selection rectangle around the area with the object you want to select. The Select a Device dialog box will open listing all of the devices in the selection area. |
Box Zoom | Box Zoom allows you to focus on an area. Click and hold the middle mouse button to begin drawing the rectangle and release it to complete drawing the rectangle; the Viewer will display the area selected at a zoom level that allows the area to fill the Viewer drawing area. |
Zoom out | Scroll upward with the scroll wheel, if available. |
Zoom in | Scroll downward with the scroll wheel, if available. |
Open the Control Tool | Double-click the object. |
Move the map | Click and drag the map to a new location. |
Flick map | If you drag in the Viewer drawing area while pressing the left mouse button and then release the mouse button (while in the dragging motion), the Viewer map will continue to move in the direction you were dragging (for a bit). |
Scaling Symbols and Text
To make the symbols for disconnects, breakers, and conditions prominent while zoomed out, select Symbols Bigger () from the Viewer's Actions menu. The symbols remain large even as you zoom out, but will still disappear at standard Declutter levels. Conversely, you may make the symbols smaller by selecting Symbols Smaller ().
To make text annotations, such as device ID, phase indicator, and so on, larger, select Text Bigger () from the Viewer's Actions menu. To make text smaller, select Smaller Text ().
To reset symbols and text to their standard sizes, select Reset Size () from the Viewer's Actions menu.
Displaying Pointer Coordinates
To view the coordinates of a point in the Viewer, click and select Pointer Coordinates... from the Viewer's Actions menu. The Pointer Coordinates dialog box will open with the following information:
• Window X/Y: the position in the current drawing area view.
• Coordinates (X/Y) (Geographic Coordinate System)
• Latitude/Longitude
• Distance from Previous Coordinate (Feet)
Note: The keyboard accelerator (C) is very useful for quickly opening the Pointer Coordinates window.
Viewer Focus
The Viewer's Focus option is context aware and will function according to your selection.
• If you select an object in the Viewer, clicking the Viewer Focus button will focus on that object.
• If you select an event in the Work Agenda and click the Viewer Focus button, the Viewer will focus on the device/object associated with the event.
Focus on Viewer Selection
If you select an object in a geographic view in the Viewer and click the Focus button, the Viewer will center the object and zoom in/out as necessary. If the object is part of a substation or internal diagram view, the first Focus action will display the object in the substation or internal diagram view. Each successive click will cycle the Viewer through alternate views, if available, until it cycles back to the geographic view.
If one line feeder schematics or normal schematics are configured, the Viewer Focus button () will not include these in the set of maps it focuses on, you will need to click the Feeder One Line button () or Schematic Diagram button () to navigate to that view.
Note: Viewing schematics may not reflect the current (real-time) state of the network since the schematic views are generated by the model build process.
Example: Substation Breaker Focus
1.  A substation breaker is selected.
A substation breaker is selected.2. Click the Focus button (); the substation internal view appears.

3. Click the Focus button () to return to the original network view.
4. Click the Schematic focus button () and the station schematic view will appear, if one exists, with the device centered in the schematic view.
To return to the geographic view, click the Focus button ().
Focus on Selection Made in another Window
When you make a selection of an event in another window (for example, the Work Agenda) and click the Viewer Focus button, the Viewer will find the device and focus the drawing area on it.
Using Feeder Focus
The Viewer's Feeder Focus feature traces from a selected device back to its feeder breaker and to all downstream devices on the same feeder.
Note: Feeder Focus uses the real-time status or the status from the current study session. It does not display devices that may be part of the feeder in the nominal configuration but not currently part of the feeder.
Feeder Focus should not be used at times of heavy system activity such as those that occur when there are many outages in the system caused by major events and storms.
To use the Feeder Focus feature, complete these steps:
1. Select a device in the Viewer drawing area.
2. Select Feeder Focus from the Actions menu or press the F key (the keyboard shortcut). All symbols disappear except the feeder the device is on.
3. To turn Feeder Focus off and show all the symbols again, press F.
Unlike tracing, no other electrical devices are shown except those on the selected feeder. The Feeder Focus will not include de-energized downstream devices. Feeder Focus displays background layers that have been enabled with the Hide/Display dialog box. While in Feeder Focus, you can use Hide/Display, Declutter, and Big Symbols.
Feeder Focus on Adjacent Feeders
To view the feeders adjacent to a feeder in Feeder Focus, select Change Focus Feeders... from the Viewer's Actions menu. The Select Feeders to Display dialog box will open allowing with the list of the feeder in focus and all adjacent feeders.
Note: The current feeder will be highlighted (selected) when the dialog box opens.
From the list, you may:
• Select additional feeders to view.
• Deselect feeders in view; you may remove the initial Feeder Focus feeder.
Note: Use standard Shift+click/Control+click selection methods to select and deselect feeders.
Button Actions
• Reset: reselects the last applied feeders in focus.
• Apply: updates the Viewer with the selected feeders in feeder focus.
• OK: updates the Viewer with the selected feeders in feeder focus and closes the dialog box.
• Cancel: closes the dialog box without updating Viewer.
The dialog box will remain open allowing you to change the feeders in focus until you either click OK or Cancel or remove the Viewer from Feeder Focus mode.
Feeder Focus in CNV Mode
In CNV mode, the feeder focus has some enhancements to improve the experience. When a feeder is focused, a panel will be added to the top right of the Viewer which allows access to additional feeder focus functionality.
This panel can be collapsed to save space, and has the following functionality:
• Zoom to show extent of focused feeders
• Add or remove feeders from the focus with the drop down selector
• Remove the feeder focus with the close button in the top right
• Restrict Selection - only allow those feeders that are focused to be selected (this will automatically happen if the non-focused feeders are completely hidden with the slider at the bottom).
• Nominal - Highlight based on nominal feeder assignments. This can be useful to include deenergized sections of network.
• Zoom - Zooms to show full extent of feeders when they are focused
• Automatic Feeder Highlighting - In this mode feeders will be automatically highlighted as a result of positioning the Viewer on a device, or if devices in non-focused feeders are selected (including tie switches). This can be useful for exploring out to tied feeders, and to automatically focus on targeted devices.
• Dimmed Network Opacity slider. This provides convenient access to the setting from the Map Settings panel which controls the amount of dimming applied to non-focused feeders. Note this also allows them to be completely hidden if desired
Viewing One Line Feeder Schematics
The Viewer's Feeder One Line feature allows you to see one line feeder schematics views.
1. To initiate the feeder one line view, select an object and press 1.
 | The Viewer will display the Feeder One Line view.  |
Note: Alternatively, you may select Feeder One Line from the Actions menu or click the toolbar button ().
2. To see adjacent feeders in the schematic view, select a tie device in the standard view and press 1.
 | The Viewer will display the adjacent feeders schematic with lines highlighted to show the connections.  |
Using Lens Windows
The Viewer's Lens functionality allows you to start a "mini-Viewer" window that is focused and zoomed in on a selected device. To start a Lens window, select a device in the Viewer and select Show Lens from the Viewer's Actions menu. The Lens window will open zoomed in on the device.

Behaviors of the Lens Window and Viewer Lens Area
The area displayed in the Lens window is indicated by a red rectangle in the Viewer's Drawing Area. The red rectangle may be moved directly in the Viewer by clicking and dragging. As the rectangle moves, the Lens window will update to show the area inside the rectangle. Likewise, panning and zooming in the Lens window will be reflected by position and size of the rectangle in the Viewer.
When the Lens is started, its text size, symbol size, attribute size, coloring rule, big symbols, and power flow arrow settings are all synchronized with the Viewer; thereafter, the Lens settings are independent. If you want to resynchronize the Lens settings with the Viewer settings, close and reopen the Lens. Note that real-time/study mode and tracing are always synchronized between the Viewer and the Lens.
Real-Time and Study Mode
NMS applications start in real-time mode, where every action you perform is applied to the real-time model and displayed to all users. Certain windows (the Viewer and the Control Tool) allow you to change to study mode, where your actions are reflected in your study session on your workstation, but not recorded in the real-time model. Study mode is especially useful in "what if" studies, when you need to evaluate the effects of an action before you record it in real-time.
When in real-time mode, the Viewer displays status, topology, and condition information based on real-time operations information. All changes to these items made by any user in real-time mode are reflected on all real-time Viewers in the system.
When in study mode, the Viewer displays only status and topology changes you make on your workstation. Changes made in your study session are not reflected in the real-time model, and likewise changes made in real-time are not reflected in your study session. When in study mode, the Viewer displays information about the study session in the upper left corner of the drawing area and there is a green glow inside the window frame.

A study session is created for a specific workstation the first time you put the Viewer into study mode. The study session is initially created as a copy of the current real-time model. From that point on, changes in the study session and real-time are independent of each other. You can reset the study session to current real-time by using the Study Session Control tool. In addition, some Web Switching Management actions can also cause study session resets. Please refer to the Web Switching Management chapter for more information.
Note: It is recommended that you reset study sessions to real-time as often as makes sense (for example, when starting a new switching plan, testing a new ‘what if' scenario, and so on). This is especially important during high load periods (for example, a storm).
Switching to Study Mode
To toggle the Viewer to study mode, do one of the following:
• Select Study from the Options menu, or
• Click the study mode button () on the toolbar.
The Viewer window borders change color to gray.
• You can reset the study session to either the current real-time model or the nominal model using the Viewer's Reset Study Session… button in the Options menu.
Switching to Real-Time Mode
To toggle the Viewer back to real-time mode, do one of the following:
• Select Real Time from the Options menu, or
• Click the real-time button () on the toolbar.
The Viewer window borders and dialog boxes change color back to red.
Selecting Devices
Device Selection
To select a single device in the Viewer, click the device symbol. If you are selecting a Viewer area that has multiple objects, it will find the object that is on top using the configured draw order.
Box Selection
Box selection is used to select a device from an area containing multiple devices. To perform a box selection, Shift-click and drag in the Viewer drawing area to create a rectangular selection box. When you release the mouse, the Select a Device window opens and is populated with all devices within the selection area. Select any device in the list to highlight it in the Viewer; highlighting changes the device symbology to the selection color, but the device is not selected until a selection action is initiated.
Select a Device provides the following actions:
• Select: Selects the highlighted device and closes the window.
• Control Tool: Selects the highlighted device, opens its Control Tool, and closes the window.
• Device Details: Selects the highlighted device, opens the Device Details window above the device in the Viewer, and closes the window.
• Cancel: Closes the window. The last highlighted device, if any, will remain highlighted in the Viewer, but will not be selected for subsequent Viewer actions.
Note: Only a single device can be selected at any given time unless the Viewer is in Supply Points mode. See Graphical Grouping (Supply Points Mode) on page 3-43 for details.
Polygon Selection
Polygon selection is an advanced form of box selection. To begin a polygon selection, press the Alt key and click the Viewer drawing area to place the first anchor point; continue to press Alt and click to add additional vertices. To complete the polygon, press Alt and right-click to connect the last vertex to the first vertex. Once the selection polygon is complete, the Select a Device window will appear listing all devices that were inside the area.
Multiple Selections
If you are in Supply Points mode, you can use Box Selection or Polygon Selection to select multiple supply points. To add a supply point to your selection press the Control key and click the supply point; likewise, to remove a supply point from your selection, press the Control key and click a selected supply point. You may also add multiple supply points to your selection by pressing the Control key while performing a box selection.
Identifying Symbology
Device Symbology
Changes in the status of a device (for example, switches, fuses, breakers, and so on) are reflected by changes in symbology. For example, a closed switch is a different color and shape than an open switch.


Switch in the closed state (left) and open state (right).
Condition Symbology
Dynamic conditions on a device (for example, "predicted service outage," "crew on-site," "notes," and so on) are indicated with specific symbols attached to the device to which the conditions apply.
Condition symbols display in specific areas around a device or object. The following table provides examples of where condition symbols display in relation to the device they are attached to. The following figure displays the Viewer with probable device outage, crew on-site, note and tag conditions.
Area | Symbols |
|---|---|
Above Left | Tags |
Above Right | Probable Service/Device Outages Real Outages |
Below Left | En route/Onsite Crews |
Below Right | Notes Call Clues |
Work Agenda Interaction with Event Condition Symbols
When you select a condition symbol for an event, such as a predicted service outage symbol, the corresponding row in the Work Agenda will be highlighted and the Work Agenda table will scroll to display the row, if necessary. If the event is not in the Work Agenda filtered view, the Work Agenda will not change to a filter that would show the event and the selection will be cleared; for example, if the Work Agenda is set to show completed events, selecting an active event symbol will not change the Work Agenda to the "To Do" view to show the event.
Related
Conductor Symbology
Conductor symbology changes color, dash patterns, and thickness for different types of conductors and topology states.
Symbology | Line Pattern | Color |
|---|---|---|
Overhead Line | Solid | Varies |
Underground Cable | Dashed | Varies |
Confirmed De-energized | Dashed | Black-White |
Partially Energized | Dashed | Black-Grey |
Predicted De-energized | Dashed | Feeder Color-White |
A Phase | Thin | Red |
B Phase | Thin | Yellow |
C Phase | Thin | Blue |
Loop | Magenta | |
Parallel | Purple |
Violation and Warning Symbology
Objects in the electrical model that are in warning or violation states have a yellow or red glow, respectively.

Example: Switch Warning and Conductor Violation

Device Details provides information about a selected object's warning or violation.
Related
Note: The colors are configurable so your system may be different.
Off-Nominal (Abnormal) Status Symbology
The table below illustrates how symbology identifies devices in off-nominal (abnormal) states.
Example | Description |
|---|---|
 | This illustration shows three 3‑phase switches (marked A, B, and C) in their normal states. Switch A is normally open; Switches B and C are normally closed. |
 | When Switch C is opened, an outage is created (indicated by the RO symbol) and the downstream circuit is de-energized. The symbol for Switch C changes from red (closed) to green (open), and a green circle appears around it to indicate that it is abnormally open. |
 | Switch A is closed to re-energize the circuit. The switch symbol changes to red (closed) and a red circle appears around the switch to indicate that it is abnormally closed. |
 | Opening a single phase of the normally closed Switch B, causes the device to go into a partially abnormal state, which is indicated by a yellow switch symbol surrounded by a yellow circle. The state of each phase is indicated by a color block behind the phase name. In this example, the A phase is opened and the switch shows the A with a green (open) background; the B and C phases are closed and have red backgrounds.  The downstream circuit is partially de-energized and a real outage (RO) is created. |
SCADA Symbology
For systems with SCADA Extensions, the Viewer provides many visual cues about SCADA devices and their statuses. For details on SCADA symbology, see Understanding SCADA Information in the Viewer .
Hiding and Displaying Viewer Objects
The Viewer's Hide/Display tool allows you to display only those map elements (for example, layers, objects, crew types) that are of interest to you. To change visibility of components displayed in the Viewer, complete these steps:
1. Click the Hide/Display () toolbar button. (Alternatively, you may select Hide/Display... from the Actions menu.)
2. Select the elements that you want displayed; deselect those elements that you do not want displayed.
Note: Hide/Display is a configurable feature of NMS so your dialog box may have different options.
3. Hide/Display options may include:
• Layer Groups: defined groups of single layers listed in the Layers pane.
• Above Ground
• Underground
• Transformers
• SCADA Switches
• All Electrical
• Basic Landbase: Refers to the display of landbase data from the Map Definition Utility.
• Layers
• Overhead Conductors
• Underground Cables
• Manholes
• Underground Fuses
• SCADA Disconnects
• SCADA Circuit Breakers
• Other Electrical
• Supply Nodes
• Roads
• Waterways
• Other Landbase
• Measurements: Refers to SCADA measurements. For more information, see Understanding SCADA Measurements.
• Show Limits: Refers to Limits associated with SCADA measurements. For more information, see Understanding SCADA Measurements.
• Highlighting
• Predicted De-energized: Adds a glow around an object that is predicted to be de-energized.
• Confirmed De-energized: Adds a glow around an object that is confirmed to be de-energized.
• Distributed Generation: Adds a glow around conductors fed (or partially fed) by distributed generation.
• Powerflow Violations: Adds a glow around an object that has a power flow violation. Disabling Violations also disables Warnings. For more information, see Using the Feeder Load Summary.
• Powerflow Warnings: Adds a glow around an object that has a power flow warning. Enabling Warnings also enables Violations.
• Assessed: Adds a glow around conductors that have been marked as assessed.
Note: If more than one highlighting color matches, the following order of importance is used:
• Violations
• Warnings
• Predicted out
• All other highlighting (following the configured conductor coloring priority).
To see the color legend for highlighting glows, select Highlight Legend... from Viewer's Help menu.
• Crew Types
• Service & Trouble
• Tree
• Line
• Eval
• Show Assigned: Allows symbols for assigned crews to be displayed.
• Incidents: Allows you to choose whether to display all calls or just AMI notifications and whether to display symbols for all damaged assets or only the main asset for each damage report.
• Show All Calls
• Show All AMI
• Show FLA by Default
• Show All Damage
• Spatial Landbase Menu: Allows you to chose which Spatial Landbase to use. The options available will depend on your installation.
• None
• Web Map Server 1 Road
• Web Map Server 1 Aerial
• Web Map Server 2 Road
• Web Map Server 2 Aerial
• Oracle: Refers to the display of Spatial Landbase data from an Oracle Locator or Oracle Spatial base map defined using Oracle MapBuilder. MapBuilder is a standalone graphical tool for creating and editing styles, themes, and base maps.
• Oracle with Outage Summary
• The Network Level menu allows you to choose to display:
• All Primary (the default)
• Backbone Only
• Primary and Secondary
• Backbone and Laterals
• The Phases menu allows you to choose to display:
• All Phases (the default)
• Multi-Phase
• 3-Phase Only
• The Pending Devices menu allows you to choose to display construction pending, decommissioning conditions, and inactive devices. Options are:
• Hide Pending Devices (the default)
• Show Pending Devices
4. Click the Close button to close the Hide/Display dialog box.
Decluttering the Viewer
The Viewer automatically hides objects based on predefined declutter zoom levels. This allows you to only see high-level information at higher zoom levels, removing small text and other items that are no longer readable at that zoom level. When an object is decluttered, any associated conditions and text will also be decluttered. The declutter option in enabled by default, but you can turn it off by unchecking the Declutter (On/Off) option in the Hide/Display dialog box.
Hiding Conditions with Devices
The Hide Conditions with Devices option, which is selected by default, will hide all conditions when their associated devices are hidden, either due to other Hide/Display options or decluttering. When not checked, the conditions will always display, even when their devices do not.
Hide/Display Example
The following example demonstrates hiding two devices, displaying device conditions for a device that has been hidden, and removing highlighting from a conductor.
Unchecking the SCADA Disconnects and Other Electrical layers causes the Viewer to hide the devices; unchecking the Confirmed De-energized hides the black highlighting; unchecking the Hide Conditions with Devices option causes the Outage symbol remain visible when the associated device is hidden.

Adjusting Condition Display
Device Conditions and measurements can be moved to tidy the Viewer display. Operations users can temporarily move a condition that takes effect only for them and only for their current session. Administrators can move conditions and further adjust condition display; the Administrator changes affect all users system wide and persist thereafter. If you have permission to move conditions, the Move option will be available through the right‑click context menu when selecting the condition symbol.
Note: If multiple conditions are shown at a position, only the condition closest to the device can be selected to be moved, but it will adjust the relative placement of all conditions stacked with that condition.
Move: Allows moving a condition for the device to a new location. This changes the placement for conditions that appear at a certain location.
For example, if the condition is in the lower left position, any conditions that are in the lower left will display at the new location.
The following additional right-click options are only available for the Administration user type:
• Show Leader line: Turns the leader line on.
• Hide Leader line: Turns the leader line off.
• Reset Location: Restores the condition to the default location.
If a measurement is right‑clicked, the following additional options are available:
• Rotate Clockwise
• Rotate Counterclockwise
• Resize Bigger
• Resize Smaller
Executing Traces
The trace feature allows you to display the path from a selected device to other devices based on specific criteria. The trace path is displayed on the Viewer by changing all conductors that are part of the path to a thick light blue.
This section includes the following topics:
For a description of the fields and buttons on the Trace dialog box, see Using the Trace Dialog Box.
Trace Types
The following table describes the various types of traces.
Trace Type | Description |
|---|---|
To Source | Traces from the selected device to its energizing source. |
All Connected | Traces from the selected device to all connected devices, stopping only at energizing sources. |
To Transformer | Traces from the selected device to upstream and downstream transformers. |
To Switch | Traces from the selected device to upstream and downstream switches. |
To Device Class | Traces from the selected device to a device class. Click the Search button () to open the Select Class dialog box, which displays a tree list of device classes. Multiple device classes can be chosen by holding down the CTRL key when selecting additional classes. After making your selection, click the OK button to close the dialog box. |
To Open Points | Traces from the selected device to all directly-connected open points on the feeder. |
To Nominally Open Points | Traces from the selected device to all directly connected nominally open points on the feeder. |
Using the Trace Dialog Box
Understanding the Trace Dialog Box Toolbar
Toolbar Icon | Description |
|---|---|
The Trace button executes the trace. | |
The Clear button erases the trace color from the Viewer and returns to normal color. | |
The Refresh button performs the trace again. This is useful if devices have been operated or the model was rebuilt. | |
The Trace Focus button focuses the Viewer on the entire extent of the trace. | |
The Endpoint button focuses the Viewer on the endpoint device of the trace. This option is disabled if the trace is in all directions (since there will not be a single endpoint). | |
The Upstream Impedance Report button displays a dialog box with all configured upstream devices, their solved voltages, and their modeled impedances. Only available if Power Flow Extensions are licensed. See Inspecting Impedances with the Upstream Impedance Report. | |
The Help button displays online help for the Trace function. |
Understanding the Trace Details Pane
To display the Trace dialog box, click the Trace button on the Viewer toolbar and select an object. The Trace dialog box displays the following fields and buttons:
• The first drop-down list allows you to select the trace type, as described in the Trace Type table above.
• The second drop-down list allows you to select the trace direction:
• Upstream: Constrains the trace to be only upstream of the selected device.
• Downstream: Constrains the trace to be only downstream of the selected device.
• All: Allows the trace to be both downstream and upstream of the selected device.
Note: Tracing all connected devices will automatically trace both upstream and downstream. Tracing to source will automatically trace upstream.
• The third drop-down list allows you to select the trace mode:
• Current Session: Performs the trace by using statuses currently displayed in the Viewer. This is the default.
• Nominal: Performs the trace by assuming nominal statuses for all devices.
• The fourth drop‑down list allows you to select what devices to display in the Trace Results dialog box table:
• No Table: The Trace Results dialog box is not displayed.
• Protective Devices: The Trace Result dialog box shows devices and fuses along the trace.
• Switches: The Trace Result dialog box shows all switches along the trace.
• Device Class: Allows you to open the Select Class dialog box to choose one or more classes to show in the Trace Results dialog box; see Using the Select Class Dialog Box for details.
• All Devices: All devices along the trace will be shown in the Trace Results dialog box.
• The check‑boxes enable you to select specific phases to trace. By default, all available phases on the selected object are checked.
Advanced Trace Dialog Box Fields
Click the Advanced (Expand) button in the bottom-right corner of the Trace dialog box to display additional information about the selected object, including detailed topology. You can also inspect direct connections and navigate to connected objects.
When you click the Advanced button, the Trace dialog box expands to display the following information.
The Device Details section displays the following device information:
• Device type
• Device handle
• Network Component Group (NCG)
• Map containing the device
• Display group
The Symbol Details section displays the following symbol information:
• Symbology class
• Symbol ID
• Coloring status
• Valid statuses
• Coloring rule
• Symbol coordinates
The Connectivity Details section displays the following connection information:
• Feeders
• Current statuses
• Nominal statuses
• Other statuses
The Connections section displays a list of connected nodes for the selected object. You can expand the list of connections for each node and focus the Viewer on an object in the list. For more information, see Inspecting Direct Connections and Navigating to Connected Objects.
Executing a Trace
To execute a trace, complete these steps:
1. Select the device you want to trace from and click the Trace button (). (See Using the Trace Dialog Box for field descriptions.)
2. Select the trace type, direction, mode, and the phases to trace, as described in the following table:
To trace... | Do this… |
|---|---|
To all connected devices | Select All Connected from the drop-down list and then click the Trace button. The Viewer traces from the device to all connected devices stopping only at an energizing source. |
To connected transformers | Select To Transformer from the first drop-down list and select the direction from the second drop-down list. Click the Trace button. The Viewer traces from the device to all transformers in the specified direction. |
To connected switches | Select To Switch from the first drop-down list and then select the direction from the second drop-down list. Click the Trace button. The Viewer traces from the device to the nearest switch in the specified direction. |
To the energizing source | Select To Source from the first drop-down list. Click the Trace button. The Viewer traces from the device upstream to the energizing source. |
To a specific device class | Select "To Device Class" from the first drop-down list. The Device Class field and Search button will be displayed. Click the Search button to open the Select Class dialog box. Expand the electrical object tree and select the device class that you wish to trace to. Click OK to populate the Device Class field. Click the Trace button. The Viewer traces to that device class. |
A specific phase | Select the phase you want to trace. Select the tracing option (All Connected, To Transformer, To Switch, or To Source) and the direction, then click the Trace button. |
Upstream | Select either "To Transformer" or "To Switch" from the first drop-down list, and then select "Upstream" from the second drop-down list. Click the Trace button. |
Downstream | Select either "To Transformer" or "To Switch" from the first drop-down list, and then select "Downstream" from the second drop-down list. Click the Trace button. |
Both upstream and downstream | Select either "To Transformer" or "To Switch" from the first drop-down list, and the select "All" from the second drop-down list. Click the Trace button. (Tracing all connected devices and tracing to the source will automatically trace both upstream and downstream.) |
Using statuses currently displayed in the Viewer | Select "Current Session" from the third drop-down list. Select the tracing option (All Connected, To Transformer, To Switch, and so on) and the direction, then click the Trace button. |
Using nominal statuses | Select "Nominal" from the third drop-down list. Select the tracing option (All Connected, To Transformer, To Switch, and so on) and the direction, then click the Trace button. |
Understanding the Trace Results Dialog Box
When you select to see trace results in a table (any selection other than No Table), the Trace Results dialog box will be displayed once you click the Trace button ().
Menus and Toolbar Options
File Menu
Menu Option | Description | Toolbar Icon |
|---|---|---|
Export | Exports the table to a CSV file. |
Help Menu
Menu Option | Description | Toolbar Icon |
|---|---|---|
Trace Results Help | Shows the online help. |
Understanding Data Table Actions
If you double‑click a table row, the table will focus the Viewer on the row's device.
If you right‑click a table row, you can choose from the following context menu options, if applicable:
• View...: Focus the Viewer on the device.
• Calculate Values: This will calculate the customer counts and kVA information for the row.
• Look Ahead...: Opens the Look Ahead dialog box. See Using the Look Ahead Dialog Box for more information.
Click OK to close the Trace Results dialog box.
Inspecting Direct Connections and Navigating to Connected Objects
Use the advanced fields on the Trace dialog box to inspect direct connections and navigate to connected objects.
1. In the Viewer drawing area, select the device you want to trace from and click the Trace button.
2. Click the Advanced button () in the bottom-right corner of the Trace dialog box. The dialog box expands to display detailed connection information.
3. In the Connections box at the bottom of dialog box, click the + sign to expand a node and display all connection branches.
4. Right-click a connection row and select Focus from the context menu. The Viewer focuses on the object and colors it with the specified color. The Trace dialog box displays details for the newly selected object, including a list of its connections. Refer to Advanced Trace Dialog Box Fields for more information.
5. Repeat steps 4 and 5 needed to inspect more connections.
Inspecting Impedances with the Upstream Impedance Report
The Upstream Impedance Report allows you to quickly view the impedances between a selected device and the associated equivalent source object. The types of devices shown in the report are configurable; by default, conductor, power transformer, and equivalent source impedances are displayed.
You may view impedances in a trace path without needing to navigate to each individual object or query the data from the NMS database. This will aid in diagnosing data issues while implementing DMS applications such as Power Flow, Feeder Load Management, Fault Location Analysis, and so on.
To access the Upstream Impedance Report, do the following:
1. In the Viewer drawing area, select the device you want to perform the upstream impedance trace from and click the Trace button ().
2. From the Trace tool dialog box, click the Upstream Impedance Report button (). The trace will be performed and the Impedance Report dialog box will open.
Upstream Device Impedances Table
The Upstream Device Impedances table lists the devices contributing impedance to the network between the selected object and the equivalent source. The devices listed will be ordered with the most upstream device first. However, if the trace encounters a parallel area, the devices in parallel may be listed in any order. Devices in a parallel state are denoted with a check mark in the Parallel column and with magenta coloring in the Order column.
To see a listed device in the Viewer, right-click the row and select View... from the context menu. The Viewer will focus on the device.
Note: Data may be copied from the table (see Exporting and Copying Table Data for instructions).
Using the Commissioning Tool
The Commissioning Tool allows you to commission a device that is currently in construction or decommission devices currently marked for removal.
To open the Commissioning Tool, select Commissioning Tool... from the Viewer's Actions menu. The Commissioning Tool displays two panes:
• The Waiting for Approval pane displays a table of devices that need to be approved and indicates their current statuses (To Commission or To Decommission).
• The Approved pane displays a table of devices approved for removal and indicates their current statuses (Commissioned or Decommissioned).
If no pending devices are currently selected, both panes will be empty.
The tables may be sorted by either the Device or Status column and may be filtered using the filter fields at the top of the table columns. The status bar at the bottom of the Commissioning Tool window indicates the current real-time or study mode status.
You can perform the following actions on the devices displayed in the Commissioning Tool window:
Task | Description |
|---|---|
Approve the selected devices. | Select one or more devices in the Waiting for Approval list and click the approve button (); alternatively, you may use the right-click menu option. The devices are moved to the Approved list and their symbols in the Viewer change from red or green to gray. |
Focus on the device in the master Viewer window. | Select a single device in either list and click the Focus button (); alternatively, you may use the right-click menu option. |
Remove selected devices from the list. | Select one or more devices in either list and click the Remove button (); alternatively, you may use the right-click menu option. |
Undo the approval for the selected device. | Select one or more devices in the Approved list and click the Undo button (); alternatively, you may use the right-click menu option. The devices are moved to the Waiting For Approval list and their symbols in the Viewer change from gray back to red or green. |