Get Directions or Access Other Map Views
The  Navigate menu allows you to select from options based on the object selected.
Navigate menu allows you to select from options based on the object selected. • Directions to Location opens a navigation site (in a new browser tab) to get directions to the object's location.
•  Cycle Available Geographic and Internal Map Views cycles through different views of the device (schematics, geographic, and so forth).
Cycle Available Geographic and Internal Map Views cycles through different views of the device (schematics, geographic, and so forth).•  View Full Extent zooms out to show the device in relation to its network.
View Full Extent zooms out to show the device in relation to its network.• View in Geographic Map changes the Map to the geographic view.
View in Geographic Map changes the Map to the geographic view.•  View Schematic Map changes the Map to the schematic view.
View Schematic Map changes the Map to the schematic view.•  View Single-Feeder Map changes the Map to show the feeder one line view.
View Single-Feeder Map changes the Map to show the feeder one line view.Note: When using Flex Operations on a touchscreen, tap on a device to display a popup menu which enables you to:
• Display the selection panel
• View the device’s tooltip
• Display the device’s right-click menu
Understanding Crew Management Features in the Map
For a selected event or crew, the right‑click context menus provide the available options for managing the crews. For a selected event, options will only be available to manage crews associated with that event. Similarly for a selected crew, options will only be available to manage the crew on events that it is already associated with.
Setting Outages as Stable or Not Stable
Predicted outages can be marked as stable or not using these menu options on the event context menu. For a detailed description of the event stable functionality, see “Working with Stable Predictions”.
Repredicting Upstream / Downstream
Options to repredict the location of an event are available when applicable to the currently selected event. For a more detailed description of these options, see “Repredicting Upstream/Downstream”.
Viewing Downstream/Connected Customers
Click the Customer List... button to view a list of customers downstream of the selected device.
Creating a New Event on a Device or Conductor
You can create a new event on a device or conductor.
1. For the selected object, select  Create Event from the Event menu. The New Event dialog box will open.
Create Event from the Event menu. The New Event dialog box will open.2. Enter the new event information, then click OK.
See “Creating an Event” for more information.
Working with Notes
You can annotate, add, edit, and delete notes on the Map.
Adding a Note
1. With a device or conductor selected, select  Add Note from the Selection Panel’s
  Tag/Note menu.
Add Note from the Selection Panel’s Tag/Note menu.2. Enter the text and then click OK.
Editing a Note
1. In the Map, select the Note symbol, then from the Selection Panel, select  Edit from the Tag/Note menu.
Edit from the Tag/Note menu.2. Edit the text, then click OK.
Deleting a Note
In the Map, select the Note symbol, then from the Selection Panel, select  Remove from the Tag/Note menu.
Remove from the Tag/Note menu.Working with Tags
You can annotate add, edit, and remove device tags on the Map.
For more information about tagging devices, see “Tagging Assets”.
To add a tag:
1. In the Map, click to select a device or conductor, then from the Selection Panel select Add Tag from the Tag/Note menu.
Tag/Note menu.2. Choose the tag type, if prompted, enter tag text, if applicable, and then click Instruct or Complete. The tag is added.
Editing a Tag
1. In the Map, select the tag symbol, then from the Selection Panel Tag panel, select Edit Condition from the Tag/Note menu.
Edit Condition from the Tag/Note menu.2. Edit the text, then click OK.
Removing a Tag
In the Map, click to select the tag symbol, then from the Selection Panel Tag panel, select Remove Condition from the Tag/Note menu.
Remove Condition from the Tag/Note menu.Operating Devices
The Operate Device dialog box is displayed when instructing or completing device operations; it allows you to verify important information before instructing or completing the device operation. It can be displayed from the Map or from a switching sheet.
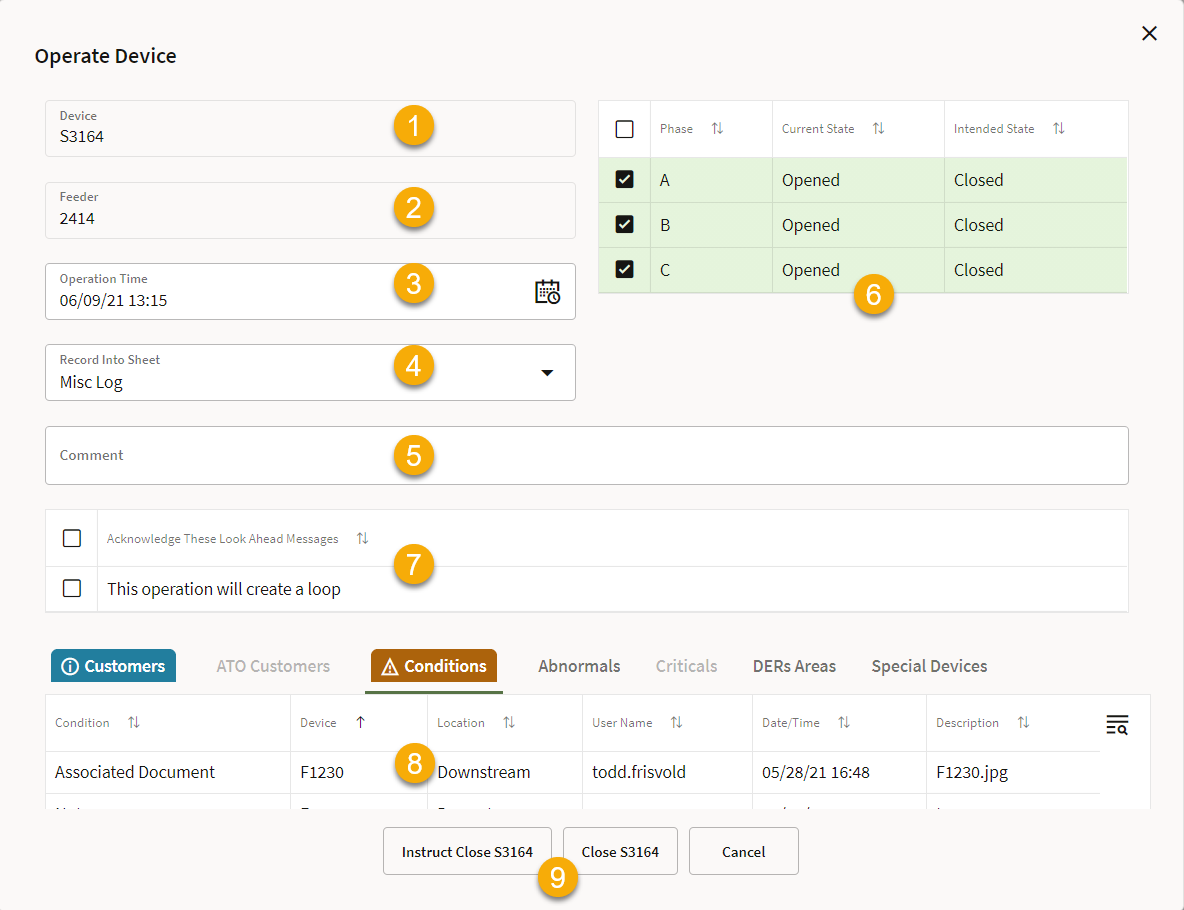
As illustrated in the screen capture above, the Operate Device dialog box has the following fields and buttons.
1. The Device to be operated.
2. The Feeder for the device to be operated.
3. The Operation Time recorded. Default to the current time, but can be backdated if required, to allow for more accurate recording of time off / time restored.
4. The Record Into Sheet field allows you to choose where the device operation will be recorded. If you are recording into a switch sheet, you can still choose to record the operation into the Miscellaneous Log, if required.
5. The Comment field allows you to add a comment to the device operation. This will be seen in the Comment field in the switching step for the device operation in the switching sheet or Miscellaneous Log.
6. The Phases table allows you to select the phase(s) to be operated. All available phases are selected by default, but can be deselected by clicking the check boxes. Clicking anywhere else on a phase row selects that row and deselects other rows.
7. The Look Ahead Messages section displays safety or electrical information messages. For example, warns you that you are going to make or break a loop, or energize a grounded section. These messages must be acknowledged/checked before the command buttons (for example, Instruct Close [Device]) become enabled.
8. The tabbed Look Ahead section provides information relevant to the impending device operation. Some information can be configured such that it must be viewed before operating the device. In cases like this, the tab with the information will oscillate until selected; once the tab has been selected and the page viewed, the command buttons become enabled.
9. Command buttons allow you to instruct or complete the device operation. These buttons will only become enabled once any electrical look ahead messages and conditions have been acknowledged.
You can operate devices as described below.
1. From the Map, select the device, then from the Selection Panel, select Open or Close, as applicable, from the Operate menu.
Note: The Operate Device dialog box will be displayed when executing switching sheet steps.
2. In the Operate Device dialog box, enter information as desired in the top panel. Things you may edit include the phases to be operated, where to record the action to (Miscellaneous Log or a switching sheet), and comments.
3. In the lower part of the Operate Device dialog box, view Look Ahead information. If the action results in conditions that need to be acknowledged, the Conditions tab will jiggle. Select the Conditions tab and view the results of the operation.
Note: For more information see “Understanding the Look Ahead Dialog Box”.
4. Once you have reviewed the information, click the Open or Close button, as applicable, to complete the operation.
In the Map, the device and network update to reflect the change in state.
Adding Damage Reports
1. In the Map, click to select a device or conductor, then from the Selection Panel, select  Add Damage Report... from the Damage menu.
Add Damage Report... from the Damage menu.2. The new Damage Assessment is displayed in a tab in the Workspace.
Record Patrolling Updates
You can add and update patrolling conditions.
Adding a Patrolling Condition
1. In the Map, click to select a device or conductor.
2. From the Selection Panel, select  Patrol Status, and then select the type of patrol condition to add:
Patrol Status, and then select the type of patrol condition to add:• Add Patrolling Condition: Adds the condition in a Patrolling state.
Add Patrolling Condition: Adds the condition in a Patrolling state.•  Add Device Patrolled: Adds the patrolling condition of Device OK.
Add Device Patrolled: Adds the patrolling condition of Device OK. •  Network Patrolled: Adds the patrolling condition to All OK. Highlights all network downstream of the selected device in a patrolled color.
Network Patrolled: Adds the patrolling condition to All OK. Highlights all network downstream of the selected device in a patrolled color.Updating the Status of a Patrolling Condition
1. In the Map, select the patrolling symbol.
2. From the Selection Panel Patrolling panel, select Edit Condition from the Tag/Note menu.
Edit Condition from the Tag/Note menu.3. In the Patrolling Condition Details dialog box, change the condition status and add a description in the Text field, then click OK.
Removing a Patrolling Condition
1. In the Map, click to select a patrolling symbol.
2. From the Selection Panel Patrolling panel, select Remove Condition from the Tag/Note menu.
Remove Condition from the Tag/Note menu.Feeder Highlights
You can highlight an entire feeder by hiding/subduing the other feeders.
For a selected device or conductor, click Feeder Highlights ( ) then click Highlight Feeder. Other feeders will be displayed less prominently, but still be selectable (so you can highlight additional feeders).
) then click Highlight Feeder. Other feeders will be displayed less prominently, but still be selectable (so you can highlight additional feeders).To remove or clear feeder highlighting, click to select the feeder then choose Unhighlight or Clear Highlighting. You can also clear highlighting from the Highlighting indicator displayed in the top-right of the Map.
Viewing Downstream/Connected Customers
Click the  Customer List... button to view a list of customers downstream of the selected device.
Customer List... button to view a list of customers downstream of the selected device.Examining Network Devices, Assets, and Symbols
To find out more about an asset or symbol, select it and then click the Attributes button from the Selection Panel.
Using the Trace Feature
The Trace tab enables you to perform traces:
1. Click to select a network asset like a device or conductor.
2. In the Trace To box, select the trace stop class.
3. Choose the Direction to trace.
4. Choose the Phase(s) to trace.
5. Click  to perform the trace.
to perform the trace.After a trace has been performed you can perform the following actions:
• Clear ( ) the trace as displayed on the Map
) the trace as displayed on the Map• Refresh ( ) the trace
) the trace• Target ( ) the trace, to the Extent of the trace, or on the Start Point
) the trace, to the Extent of the trace, or on the Start Point• View ( )the Trace Results. Trace results are displayed in a panel, and for each result you can right-click to position on the object, or fetch calculated values.
)the Trace Results. Trace results are displayed in a panel, and for each result you can right-click to position on the object, or fetch calculated values.A list of recent traces is displayed, and actions can be performed on each trace in the list. See “Executing Traces” for more information on trace options.