Post Bill End Uses Module
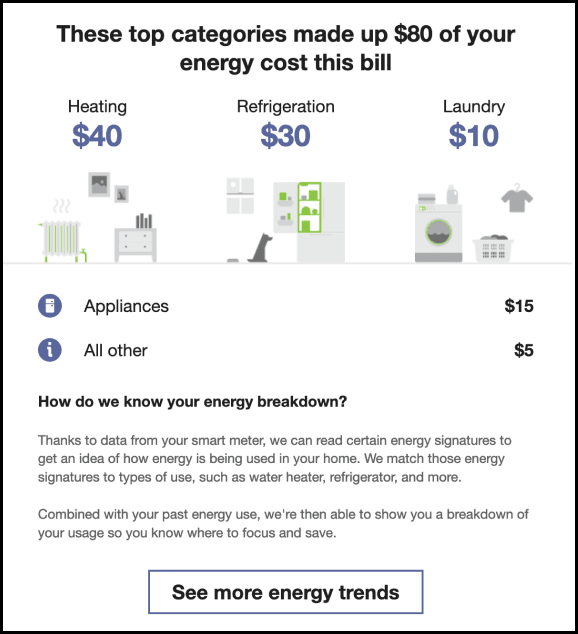
The Post Bill End Uses module breaks down how energy was used during the current bill period, and shows the customer what their top energy use categories are. Depending on the disaggregation modules the utility is using, the fuel type of the customer, and the customer data that is available, the module can display two or three top uses, and can also list additional categories that contributed to the customer's energy use.
The module explains to the customer how we are able to calculate the breakdown, and directs them to utility resources that can help them find additional information.
Requirements and Limitations
Requirements and limitations are as follows:
- Data Requirements: A complete bill for the previous month must be available.
- Appliance Disaggregation: There are additional AMI data requirements to show advanced insights such as appliance-level disaggregation. Contact your Delivery Team for more information.
User Experience
This module includes the following components:
Top Uses Statement: The top uses statement at the top of the module indicates how much of the customer's energy was used by their top categories. For example, "These top categories made up $123 of your energy usage this bill".
Personalized Breakdown: The personalized breakdown can show up to three top end-use categories. Each category includes the following elements:
- Category Name: Each category includes a name, such as Cooling, Water Heating, or Electronics. The categories that are available depend on which disaggregation model is used.
- Category Cost: Each category shows a cost rounded to the nearest whole dollar. The costs represent the major portions of a customer's entire energy use, and are not meant to add up to the customer's total bill. The breakdown can also show percentages if cost information is not available.
- Category Icon: Each category is paired with a graphic so that customers have a visual reference and can more quickly understand the meaning of the category.
- Category Order: The categories are shown from left to right, in the order of most expensive to least expensive.
Additional Categories: Below the personalized breakdown, up to 9 additional categories can be listed. Each includes a small icon to the left, the category name, and the cost or percentage to the right.
Energy Breakdown Statement: Below the use categories, a statement tells the customer how we know about their energy breakdown. The statement starts with the heading, "How do we know your energy breakdown?" and is followed by this text:
Thanks to data from your smart meter, we can read certain energy signatures to get an idea of how energy is being used in your home. We match those energy signatures to types of use, such as water heater, refrigerator, and more.
Combined with your past energy use, we're then able to show you a breakdown of your usage so you know where to focus and save.
See More Energy Trends Button: This button should direct users to a page in the utility's website, which could differ depending on the products and additional cloud services that the utility has.
The image below is an example of the Post Bill End Uses module:
