1.4 Troubleshooting Using Zipkin Traces

You can find the required traces and troubleshoot the errors using the Zipkin Traces.

Set up the Zipkin server. For information on how to set it up, refer to the Observability User Guide.
To perform troubleshooting using Zipkin Traces:
  1. Launch the Zipkin URL.
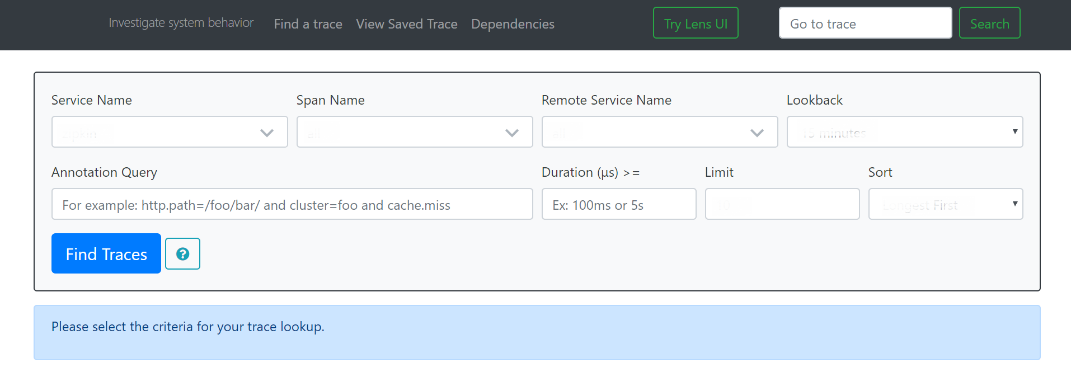
    The basic layout of Zipkin is displayed.
  2. Use the search option to find the traces of required API calls and services.

    Note:

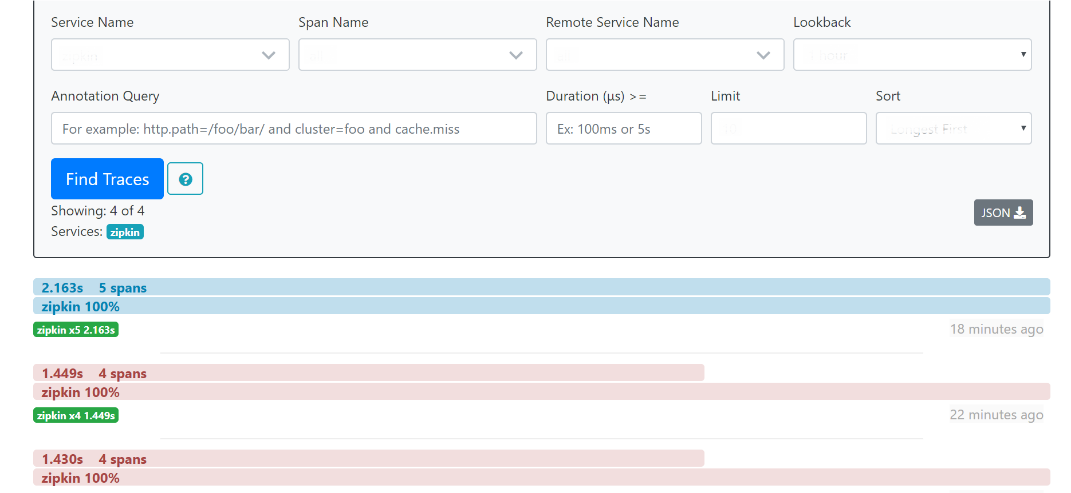
    The search options given in the user interface are self-explanatory, and there is another UI option (Try Lens UI). It is given a different user interface with the same functionality. The list of the traces can be seen as shown in Figure 1-7. Error API calls are made to showcase how to track errors. The blue listings show successful API hits, and the red listings indicate errors. Each block indicates a single trace in the listings.
    The search results are displayed.
  3. Open the individual trace.

    Note:

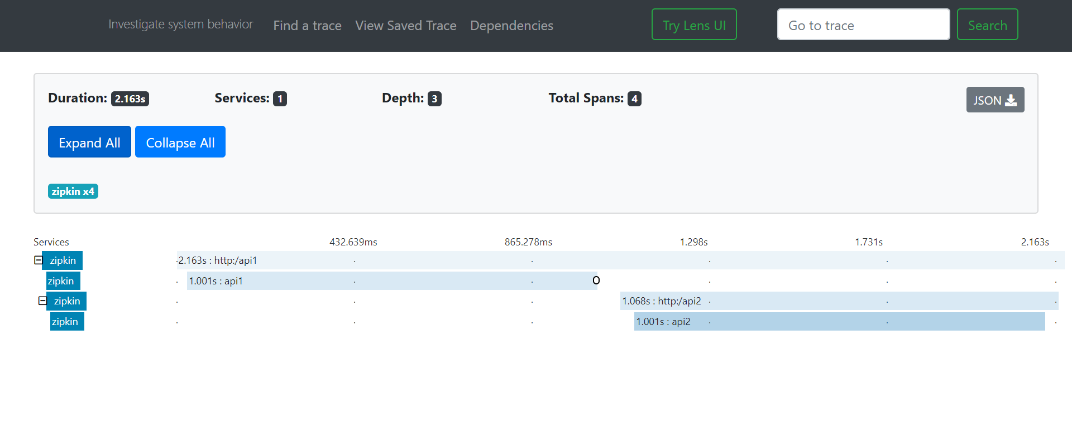
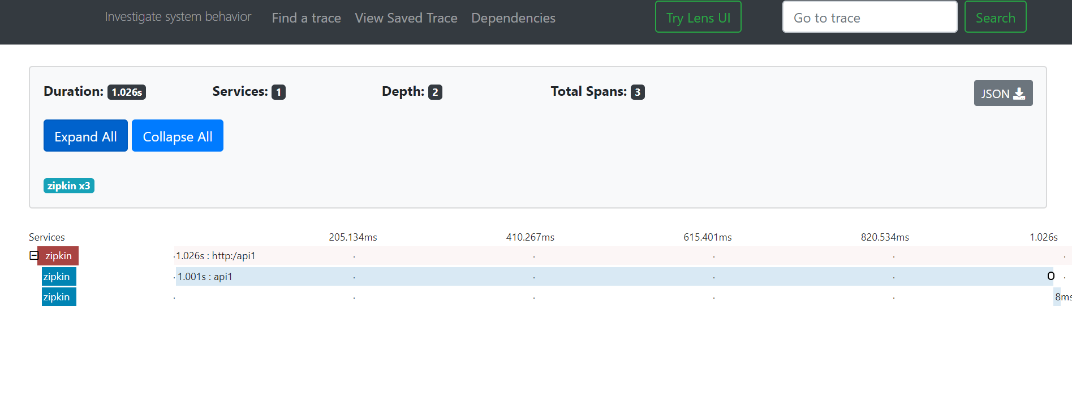
    Figure 1-8 shows an individual trace when it is opened. It also describes the time taken for each block. As the two custom spans are created inside two service calls, you can find a total of four blocks. The time taken for an individual block can be seen in Figure 1-8.
    The details of an individual trace are displayed.
  4. Click on the individual block.
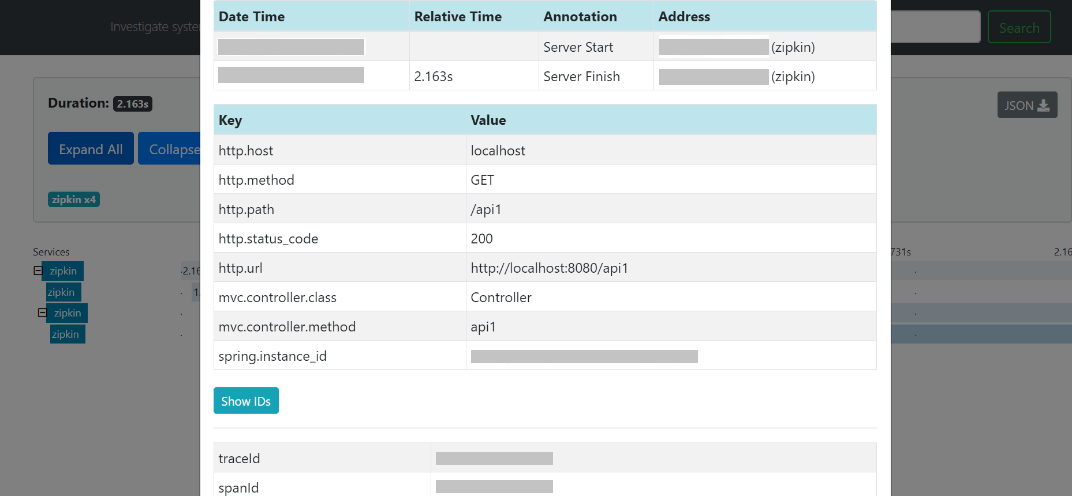
    The details of an individual block are displayed.

    Figure 1-9 Details of Individual Block


    Note:

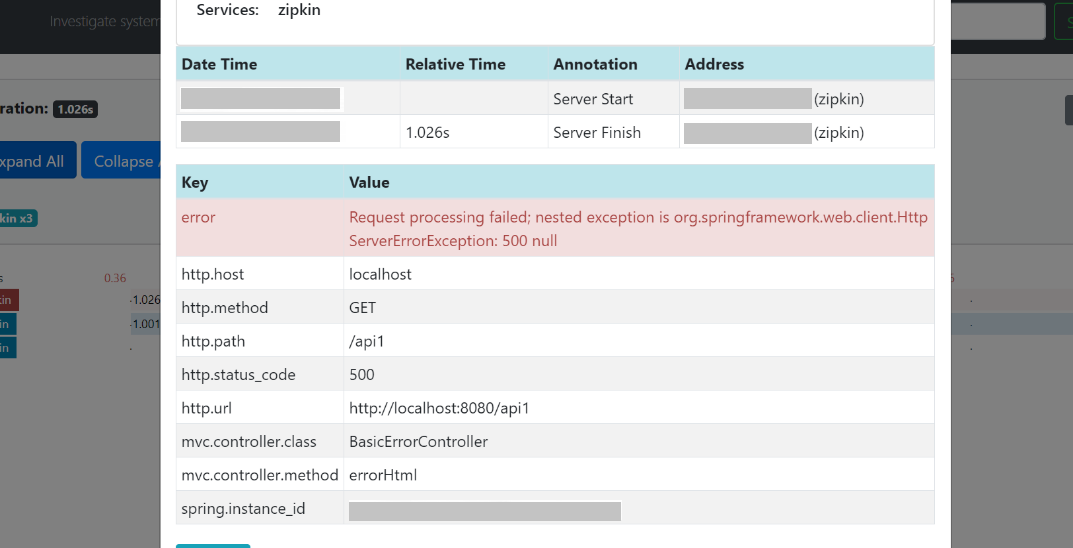
    The details of the specific span block are shown in Figure 1-9 and the logging events can also be seen in the Zipkin UI as small circular blocks. An example of an error log is shown in Figure 1-10.
  5. Click on the error portion.
    The details about the error and where the error has arisen are displayed.

    Note:

    If the Lens UI is used in Zipkin, the above figures are not applicable but are relatable to the Lens UI as well. Traces of the application can be found using TraceId. The TraceId can be found in the debug logs of the deployment when spring-cloud-sleuth is included in the dependencies (included in spring-cloud-starter-zipkin dependency).
  6. Click the Dependencies tab.
    The dependency graph information between micro-services is displayed.

    Figure 1-12 Sample Dependency Graph