Viewing Data Quality Report

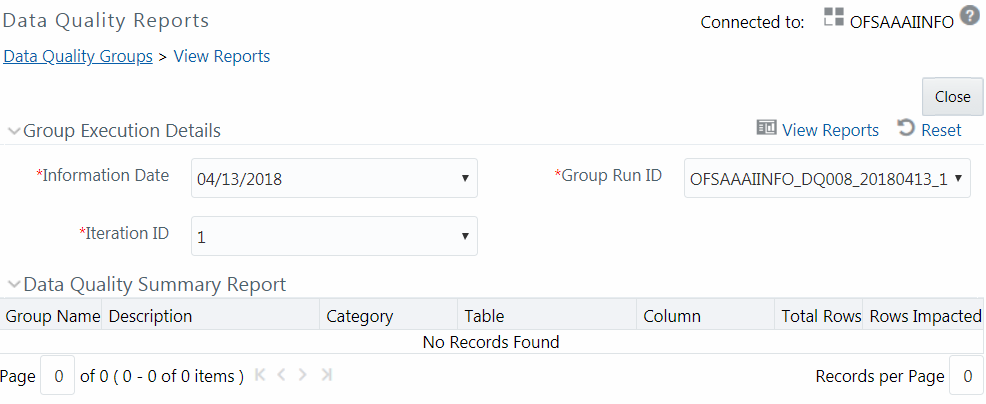
You can view the execution summary report of Data Quality Rules in the Data Quality Reports window. The Data Quality Summary Report grid displays the details such as Group Name, Description, Category, Table, Column, Total Rows, and Rows Impacted. By clicking the corresponding DQ check link under Category, you can view the Data Quality Detailed Report grid, which displays details of the record which has a data correction such as Primary Key Columns, Error Value, and Assignment value.

Note:

If you have opted to run T2T with data correction, then the data quality checking is done in the source and the Data Quality Report generated is only a preview report of the actual execution. That is, though the execution may have failed, you can view Data Quality report.
To view the Data Quality Reports window:
  1. From the Data Quality Groups Summary window, select the DQ Group Name whose DQ Report you want to view.
    The Data Quality Rules associated with the selected Group are displayed in the Data Quality Rules grid.
  2. Select the checkbox corresponding to the DQ rule and click View Reports button in the Data Quality Rules grid.
    The Data Quality Reports window is displayed.
  3. Select the Information Date from the drop-down list. Based on selection, you can select the Group Run ID and Iteration ID from the corresponding drop-down lists.
  4. Click button from the Group Execution Details toolbar.
    The Data Quality Summary Report grid is displayed.
  5. Click the DQ check link under the Category column.
    The Data Quality Detailed Report grid is displayed.

    Figure 7-50 Data Quality Reports window


    This image displays the Data Quality Reports window.

    For Control Total Check type, the Data Quality Detailed Report displays Subject Reference Value, Operator, Aggregate Reference Value, Group By columns, Aggregate Row Status and Rows Impacted.