5.2 Tables Populated by ALM Results Transformation
One or more of the following tables may be included in the ALM Results Transformation Process, depending on the calculation element and audit selections in the specific process being transformed. For example, if you have selected to produce only Standard Cash Flow output and are not consolidating multi-currency results, then only the FCT_AGG_BASE_CCY_CASHFLOWS table will be populated by the transformation process. If currency consolidation is selected, and you have multiple currencies in your data set, then additionally the consolidated results table will be populated. Similarly, when the Interest Rate Gap or Liquidity Gap calculation elements are selected in the ALM Process, then results will also be written to the corresponding FCT_ tables. The following are the primary target FCT_ tables populated by the ALM Results Transformation Process:
- FCT_AGG_BASE_CCY_CASHFLOWS
Figure 5-1 FCT_AGG_BASE_CCY_CASHFLOWS
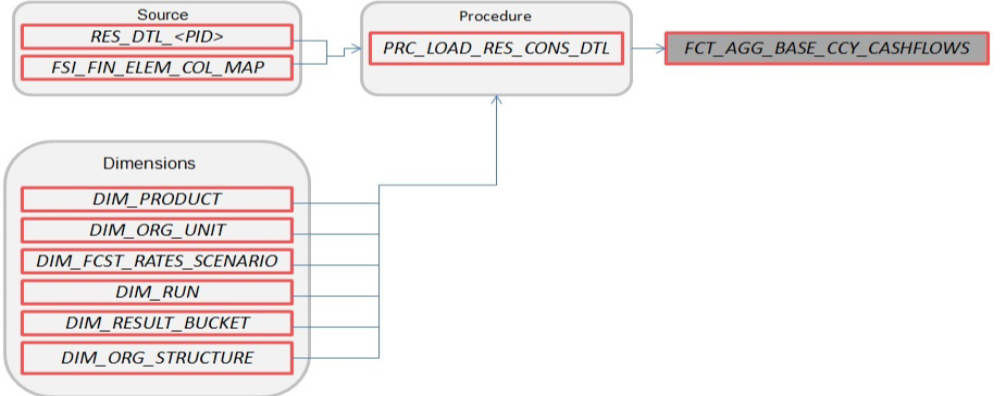
Where,
RES_DTL_<Process ID>contains the standard (base currency) cash flow output for all current position and forecast balances, across all forecast rate scenarios. - FCT_AGG_CONS_CCY_CASHFLOWS
Figure 5-2 FCT_AGG_CONS_CCY_CASHFLOWS
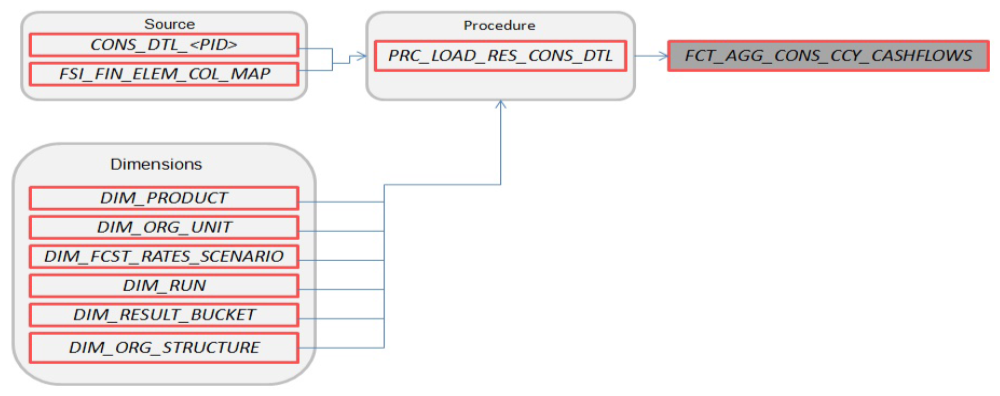
Where,
CONS_DTL_<Process ID>contains standard (consolidated to reporting currency) cash flow output for all current position and forecast balances, across all forecast rate scenarios. - FCT_AGG_BASE_CCY_LR_GAP
Figure 5-3 FCT_AGG_BASE_CCY_LR_GAP
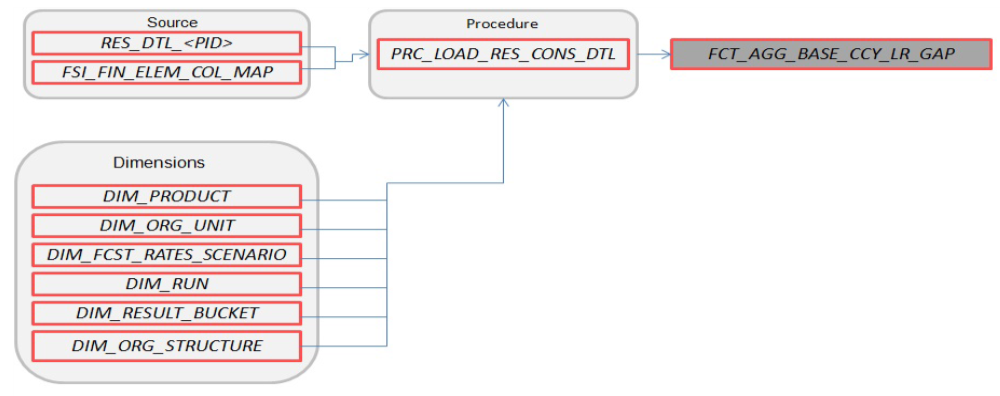
Where,
RES_DTL_<Process ID>contains Liquidity Gap Financial Element (base currency) cash flow output for all current position balances, across all forecast rate scenarios. - FCT_AGG_CONS_CCY_LR_GAP
Figure 5-4 FCT_AGG_CONS_CCY_LR_GAP
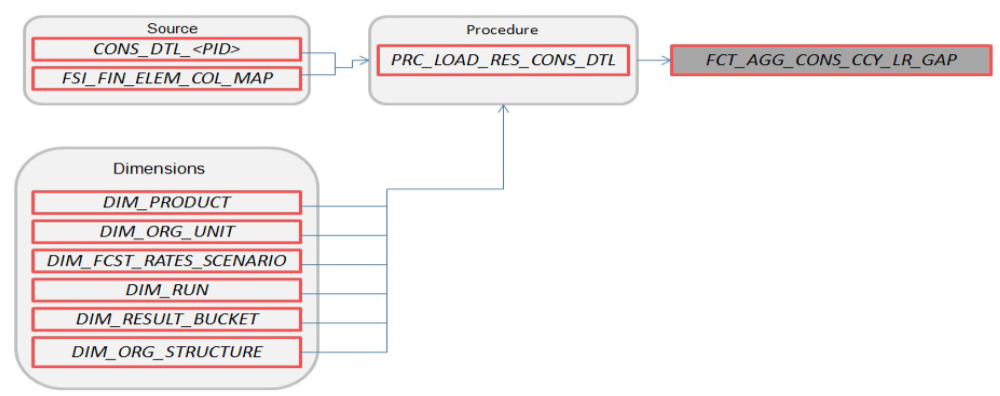
Where,
CONS_DTL_<Process ID>contains Liquidity Gap Financial Element (consolidated to reporting currency) cash flow output for all current position balances, across all forecast rate scenarios. - FCT_AGG_BASE_CCY_IRR_GAP
Figure 5-5 FCT_AGG_BASE_CCY_IRR_GAP
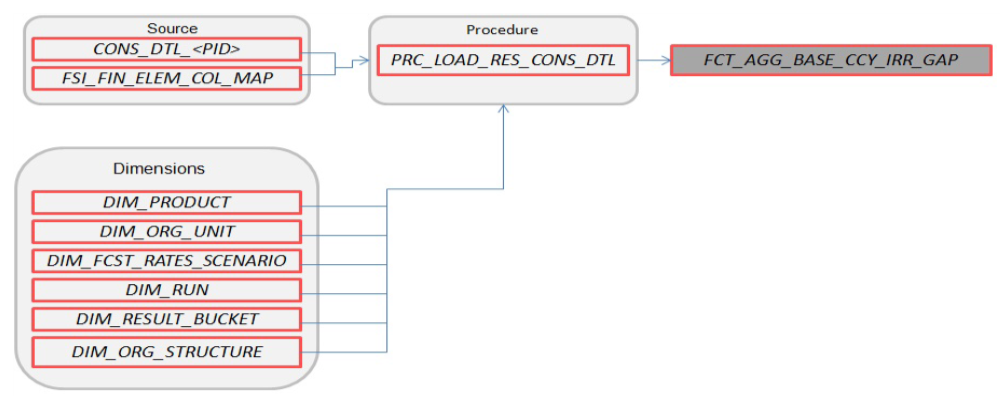
Where,
CONS_DTL_<Process ID>contains Repricing Gap Financial Element (consolidated to reporting currency) cash flow output for all current position balances, across all forecast rate scenarios. - FCT_AGG_CONS_CCY_IRR_GAP
Figure 5-6 FCT_AGG_CONS_CCY_IRR_GAP
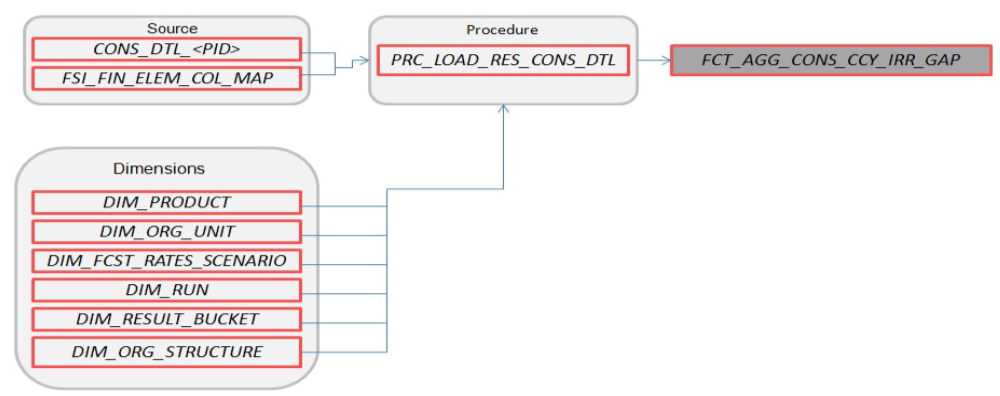
Where,
CONS_DTL_<Process ID>contains Repricing Gap Financial Element (consolidated to reporting currency) cash flow output for all current position balances, across all forecast rate scenarios. - FCT_AGG_BASE_CCY_ALM_MEASURES
Figure 5-7 FCT_AGG_BASE_CCY_ALM_MEASURES
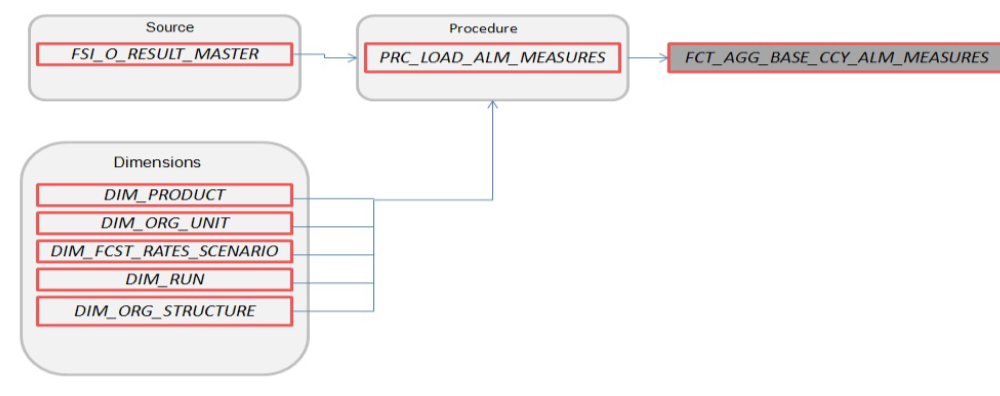
Where,
FSI_O_RESULT_MASTERcontains Market Value, Duration, and Convexity information (base currency) for all current position balances, across all forecast rate scenarios. - FCT_AGG_CONS_CCY_ALM_MEASURES
Figure 5-8 FCT_AGG_CONS_CCY_ALM_MEASURES
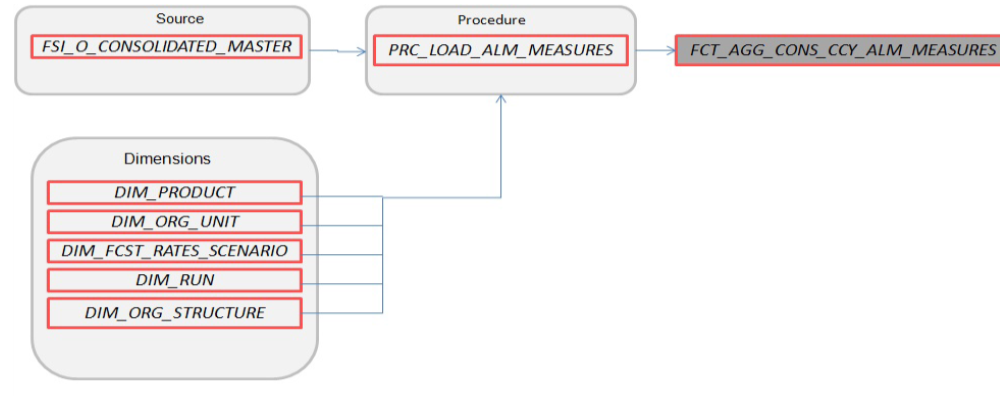
Where,
FSI_O_CONSOLIDATED_MASTERcontains Market Value, Duration, and Convexity information (consolidated to reporting currency) for all current position balances, across all forecast rate scenarios. - FCT_PROCESS_CASHFLOW
Figure 5-9 FCT_PROCESS_CASHFLOW
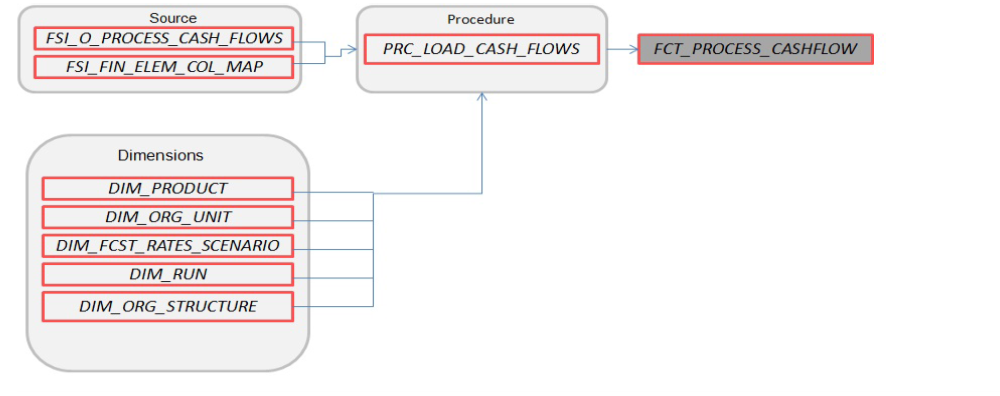
Where,
FSI_O_PROCESS_CASH_FLOWScontains account level detailed cash flow information for the number of instrument records selected on the Audit block of the ALM Process.Note:
Here, FCT_COMMON_ACCOUNT_SUMMARY is a pre-requisite for FCT_PROCESS_CASHFLOW. To run the Cash flow successfully, first load the table FCT_COMMON_ACCOUNT_SUMMARY(PK) and then FCT_PRCESS_CASHFLOW(FK). There is a Referential Integrity (PK-FK) between these two tables which should be satisfied. - FCT_RATE_TIERS_CASHFLOW
Figure 5-10 FCT_RATE_TIERS_CASHFLOW
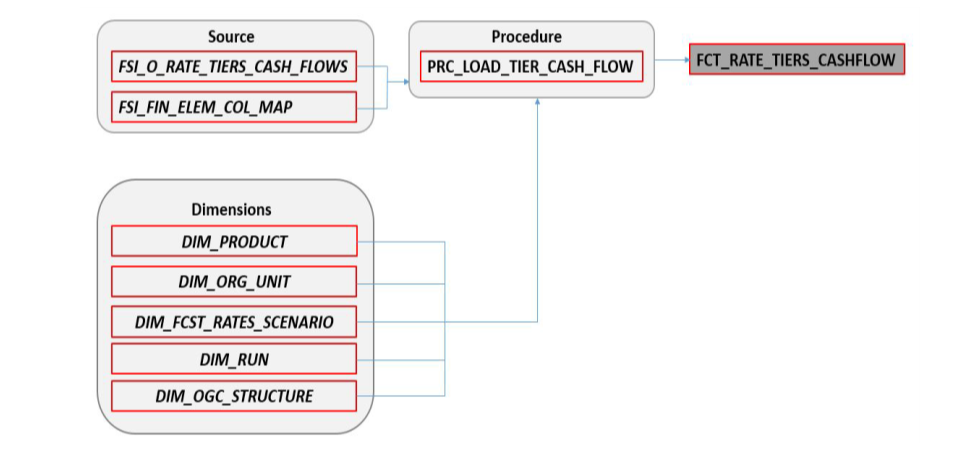
Where,
FSI_O_PROCESS_CASH_FLOWScontains account level detailed cash flow information for the number of instrument records selected on the Audit block of the ALM Process. - FCT_CONS_CCY_STOCH_VAR
Figure 5-11 FCT_CONS_CCY_STOCH_VAR
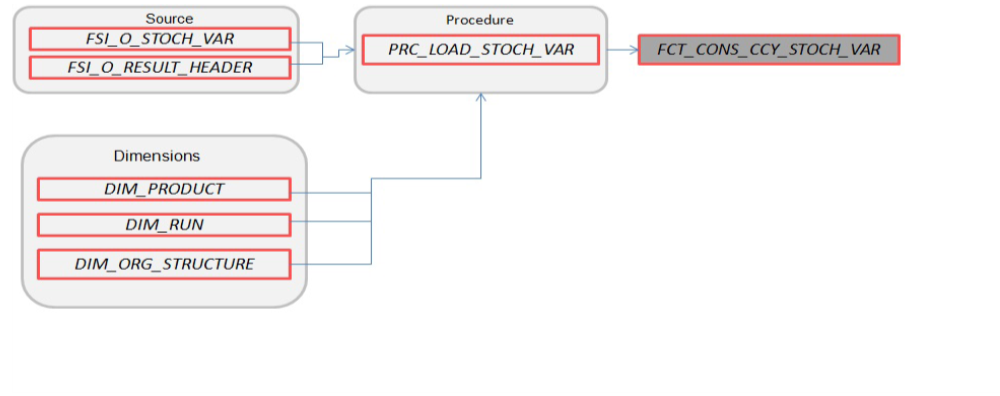
Where,
FSI_O_STOCH_VARcontains Value at Risk information (in Consolidated Currency) for each Monte Carlo rate path at the Product COA level. - FCT_AGG_CONS_CCY_STOCH_VAR
Figure 5-12 FCT_AGG_CONS_CCY_STOCH_VAR
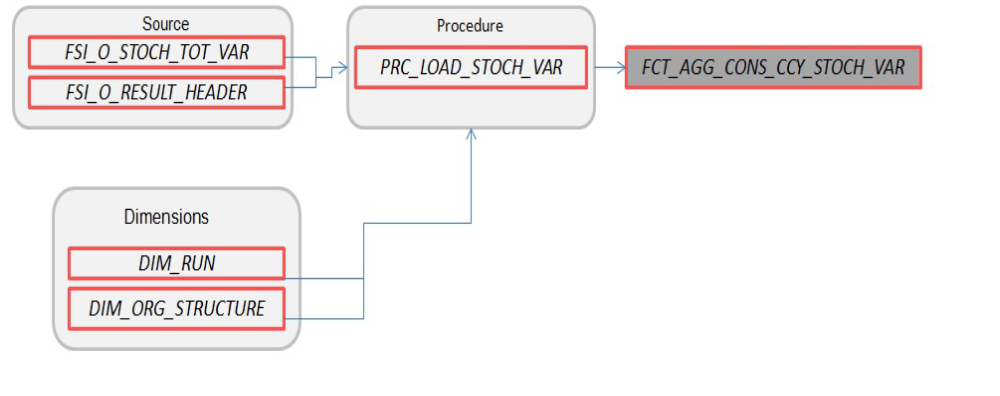
Where,
FSI_O_STOCH_TOT_VARcontains Value at Risk information (in Consolidated Currency) for each Monte Carlo rate path at the Portfolio level. - FCT_CONS_CCY_STOCH_MKT_VAL
Figure 5-13 FCT_CONS_CCY_STOCH_MKT_VAL
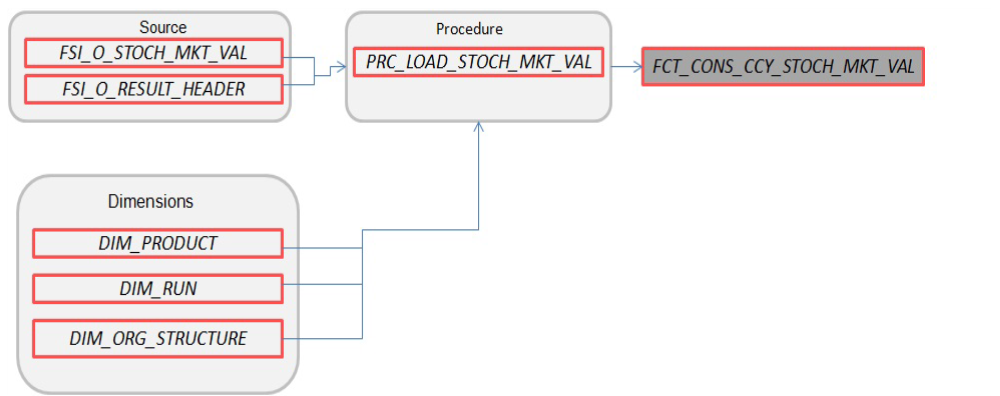
Where,
FSI_O_STOCH_MKT_VALcontains Market Value information (in Consolidated Currency) for each Monte Carlo rate path at the Product COA level. - FCT_CONS_CCY_EAR_AVG
Figure 5-14 FCT_CONS_CCY_EAR_AVG
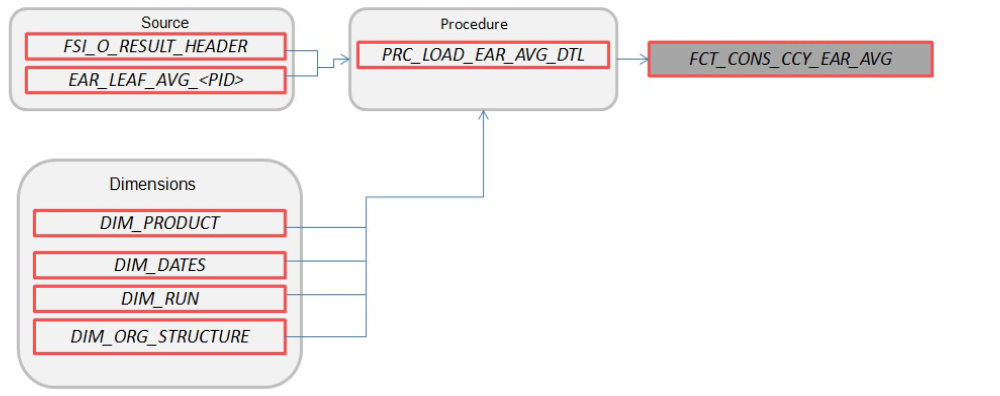
Where,
EAR_LEAF_AVG_<Process ID>contains the average Earnings at Risk information (in Consolidated Currency) across all Monte Carlo rate paths at the Product COA level. - FCT_CONS_CCY_EAR_DETAIL
Figure 5-15 FCT_CONS_CCY_EAR_DETAIL
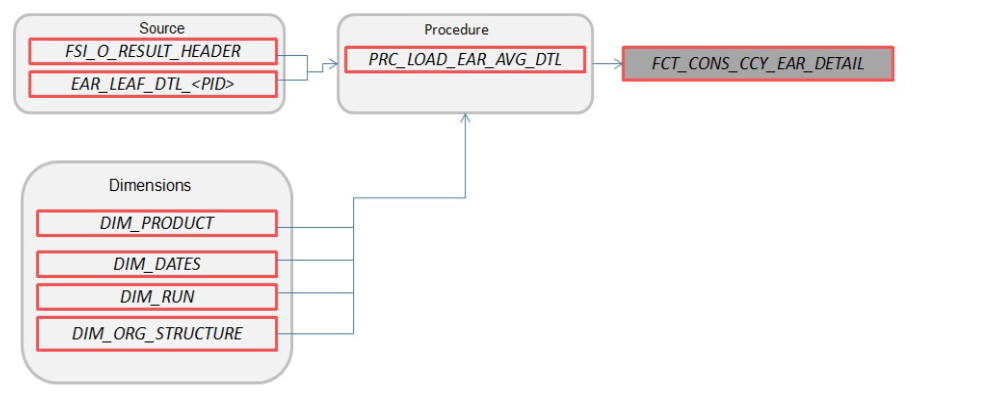
Where,
AR_LEAF_DTL_<Process ID>contains Earnings at Risk information (in Consolidated Currency) for each Monte Carlo rate path at the Product COA level. - FCT_AGG_CONS_CCY_EAR_AVG
Figure 5-16 FCT_AGG_CONS_CCY_EAR_AVG
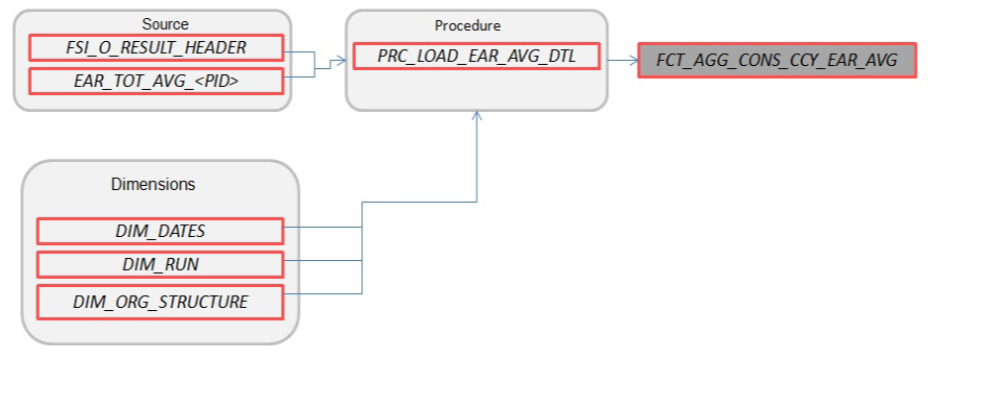
Where,
EAR_TOT_AVG_<Process ID>contains average Earnings at Risk information (in Consolidated Currency) across all Monte Carlo rate paths at the Portfolio level (net interest income - net interest expense). - FCT_AGG_CONS_CCY_EAR_DETAIL
Figure 5-17 FCT_AGG_CONS_CCY_EAR_DETAIL
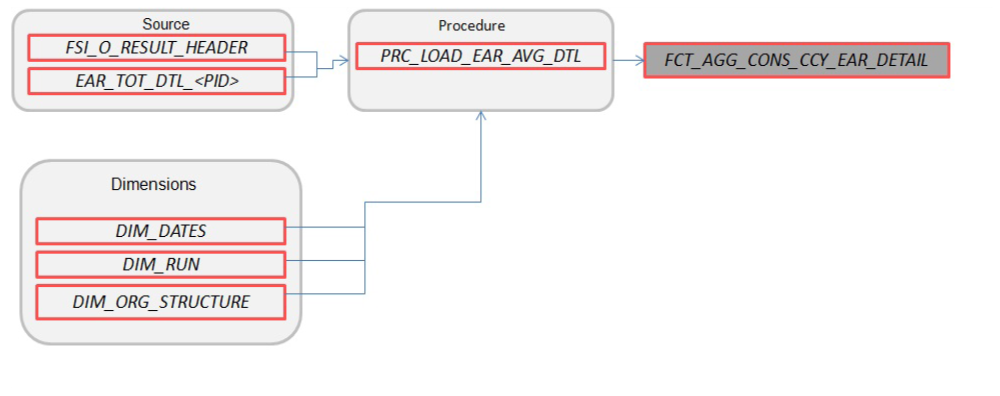
Where,
EAR_TOT_DTL_<PID>contains Earnings at Risk information (in Consolidated Currency) for each Monte Carlo rate path at the Portfolio level (net interest income – net interest expense). - FCT_STOCH_FCST_INTEREST_RATES
Figure 5-18 FCT_STOCH_FCST_INTEREST_RATES
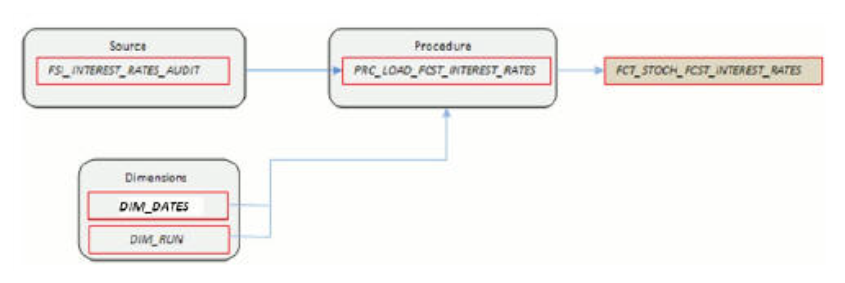
Where,
FCT_STOCH_FCST_INTEREST_RATEScontains 1M forward rates output from the Monte Carlo process for each scenario, typically used for Audit purposes. - FCT_FCST_INTEREST_RATES
Figure 5-19 FCT_FCST_INTEREST_RATES
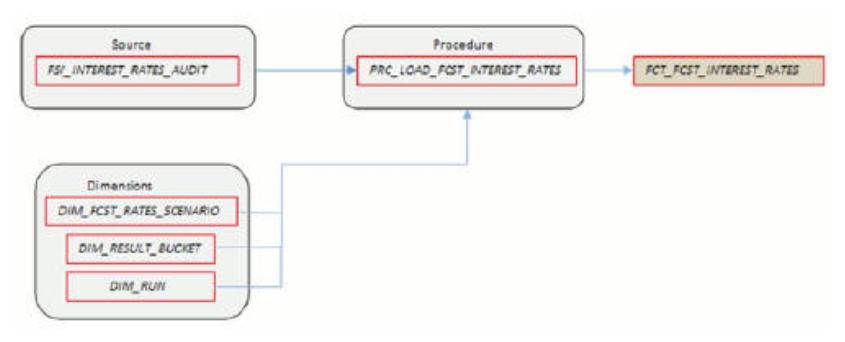
Where,
FCT_FCST_INTEREST_RATEScontains forecast interest rates for each ALM Deterministic Process, for each scenario. - FCT_FCST_EXCHANGE_RATES
Figure 5-20 FCT_FCST_EXCHANGE_RATES
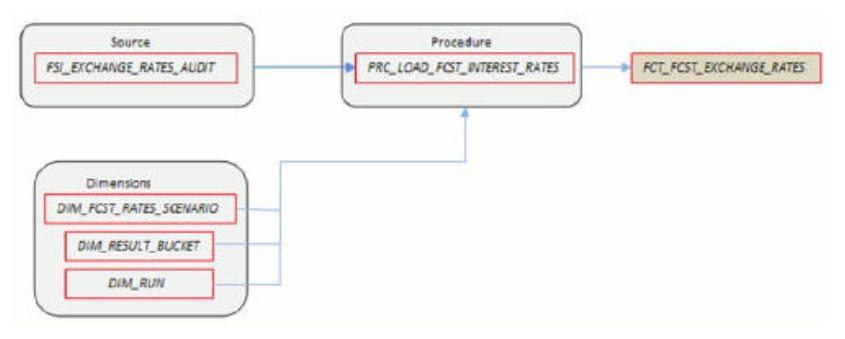
Where,
FCT_FCST_EXCHANGE_RATEScontains forecast currency exchange rates for each ALM Deterministic Process, for each scenario. - FCT_FCST_ECO_IND
Figure 5-21 FCT_FCST_ECO_IND
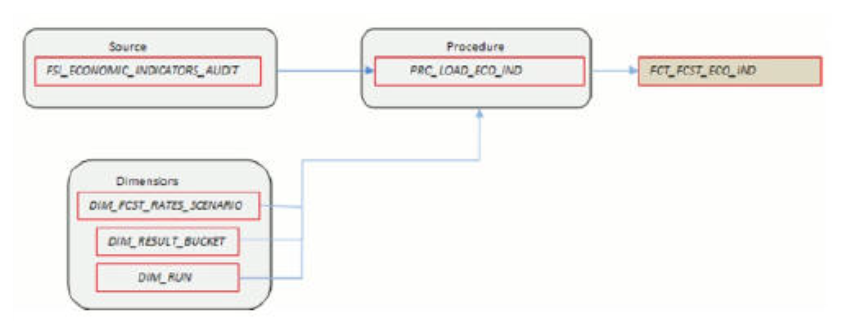
Where,
FCT_FCST_ECO_INDcontains forecast Economic Indicators for each ALM Deterministic Process, for each scenario. - FCT_ALM_GAP_LIMIT_DTL
Figure 5-22 FCT_ALM_GAP_LIMIT_DTL
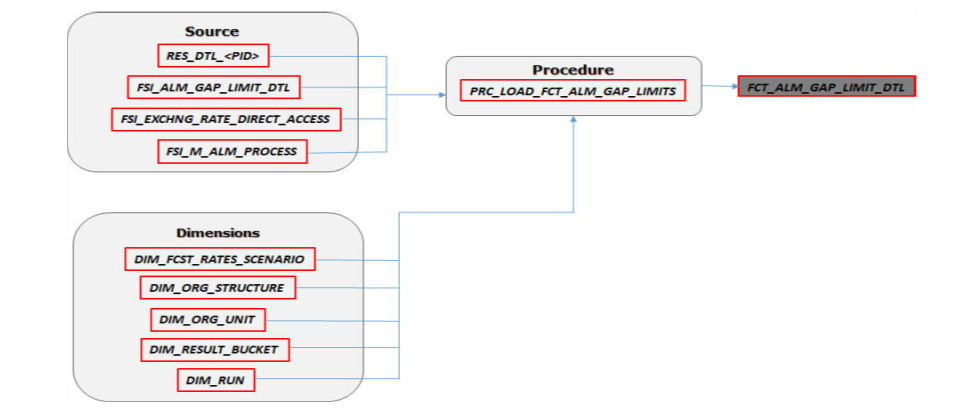
Where,
FCT_ALM_GAP_LIMIT_DTLcontains a repricing gap limit for each ALM process and for each scenario.
See the Oracle Financial Services Analytical Applications Data Model Data Dictionary or the ALM BI Erwin Data Model to view the detailed structure of these tables.