10.2.1 Equivalence of the OAS and Risk-Adjusted Margin
In a no-arbitrage economy with complete markets, the market value at time t of an instrument with cash flow rate C(t) is given by:
Equation 13
Figure 10-14 Equation 13
Description of the Transfer Pricing Option Cost Equation 13 follows and expectation is taken concerning the risk-neutral measure. The expected change in value is given by:
Equation 14
Figure 10-15 Equation 14

Description of the Transfer Pricing Option Cost Equation 14 follows:
The variation in value is therefore equal to the expected value of the change dV plus the change in the value of a martingale M in the risk-neutral measure:
Equation 15
Figure 10-16 Equation 15
Description of the Transfer Pricing Option Cost Equation 15 follows:
Let I be the market value of the money market account in which cash flows are reinvested.
Equation 16
Figure 10-17 Equation 16

Description of the Transfer Pricing Option Cost Equation 16 follows:
Note that unlike V this is a process of finite variation. By Ito's lemma.
Equation 17
Figure 10-18 Equation 17
Description of the Transfer Pricing Option Cost Equation 17 follows:
Let S be the market value of a portfolio composed of the instrument plus the money market account. We have:
Equation 18
Figure 10-19 Equation 18

Description of the Transfer Pricing Option Cost Equation 18 follows:
In other terms, the portfolio (and not the instrument) earns the risk-free rate of return. An alternate representation of this process is:
Equation 19
Figure 10-20 Equation 19

Description of the Transfer Pricing Option Cost Equation 19 follows:
Where N is another martingale in the risk-neutral measure. The expected value of the portfolio is then:
Equation 20
Figure 10-21 Equation 20

Description of the Transfer Pricing Option Cost Equation 20 follows:
Where
<N,N>
is the quadratic variation of N. This is equivalent to:
Equation 21
Figure 10-22 Equation 21

Description of the Transfer Pricing Option Cost Equation 21 follows:
Let us define the martingale:
Equation 22
Figure 10-23 Equation 22

Description of the Transfer Pricing Option Cost Equation 22 follows:
This represents the relative risk of the portfolio for the standard money market account, that is, the account where only an initial investment of V(0) is made. Then:
Equation 23
Figure 10-24 Equation 23

Description of the Transfer Pricing Option Cost Equation 23 follows:
In other terms, the expected future value of the portfolio is equal to the expected future value of the money market account adjusted by the correlation between the standard money market account and the relative risk. Assuming complete and efficient markets, banks can fully hedge their balance sheet against this relative risk, which should be neglected to calculate the contribution of a particular portfolio to the profitability of the balance sheet. Therefore:
Equation 24
Figure 10-25 Equation 24

Description of the Transfer Pricing Option Cost Equation 24 follows:
Equation 25
Figure 10-26 Equation 25

Description of the Transfer Pricing Option Cost Equation 25 follows:
In this example, the risk-adjusted rate of return of the bank on its portfolio is equal to the risk-free rate of return.
Let us suppose now that another instrument offers cash flows
C'>C
Assuming complete and efficient markets its market value will then be:
Equation 26
Figure 10-27 Equation 26

Description of the Transfer Pricing Option Cost Equation 26 follows:
The value of the corresponding portfolio is denoted by
S'>S
By analogy with the previous development, we have:
Equation 27
Figure 10-28 Equation 27

Description of the Transfer Pricing Option Cost Equation 27 follows:
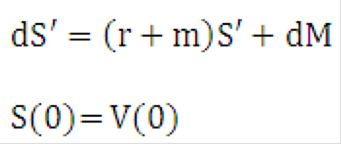
Again, the risk-adjusted rate of return of the bank on its portfolio is equal to the risk-free rate of return. Suppose now that markets are not complete and inefficient. The bank pays the value V(0) and receives cash flows equal to C'. We have:
Equation 28
Figure 10-29 Equation 28

Description of the Transfer Pricing Option Cost Equation 28 follows:
By definition of the total risk-adjusted return, we have:
Equation 29
Figure 10-30 Equation 29

Description of the Transfer Pricing Option Cost Equation 29 follows:
Therefore, by analogy with the previous development.
Equation 30
Figure 10-31 Equation 30

Description of the Transfer Pricing Option Cost Equation 30 follows:
This can be decomposed into:
Equation 31
Figure 10-32 Equation 31

Description of the Transfer Pricing Option Cost Equation 31 follows:
Equation 32
Figure 10-33 Equation 32

Description of the Transfer Pricing Option Cost Equation 32 follows:
Equation 33
Figure 10-34 Equation 33

Description of the Transfer Pricing Option Cost Equation 33 follows:
The solution of Equation 31 and Equation 33 is:
Equation 34
Figure 10-35 Equation 34

Description of solution for the Transfer Pricing Option Cost Equation 31 and 33 follows:
By the law of large numbers, Equation 31 and Equation33 result in:
Equation 35
Figure 10-36 Equation 35

Description of the Transfer Pricing Option Cost Equation 35 follows:
For example, the OAS is equal to the risk-adjusted margin.