8.1.1.3.5 Credit Line Summary
This pre-built report is based on Credit Line subject area. It gives an
overview.
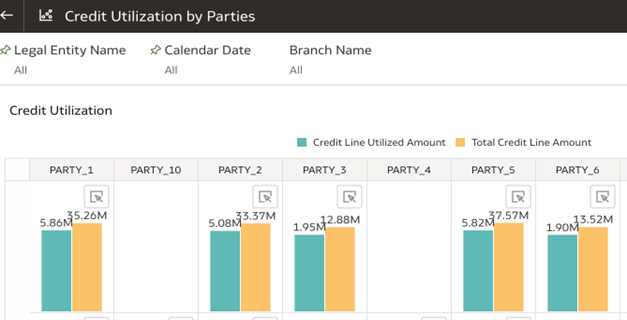
- Credit Utilization by Parties: This bar graph illustrates
total credit line against the utilized amount, and helps bank quickly assess the
overall credit utilization rate. This helps in identifying trends over time,
such as increases in credit usage which might indicate economic stress among
borrowers or a growing confidence and spending capability. The visualization
helps user analyze credit utilization numbers for each party and currency as of
date and analysis can be done at branch level.
- Objective – To highlight the total credit line and
utilized amount for various parties across different currencies as of
given date for selected branch/branches.
Figure 8-50 Credit Utilization by Parties

- Objective – To highlight the total credit line and
utilized amount for various parties across different currencies as of
given date for selected branch/branches.
- Utilization Across Product Types: The visualization
illustrates the total credit line commitment amounts and the utilized amounts
across different products denoted in multiple currencies. This helps to analyze
which products are most and least utilized, banks can identify successful
features or gaps in their offerings. This information can drive the development
of new products or adjustments to existing ones to better meet customer needs.
- Objective – To highlight the total credit line
amount and utilized amount by different product types for selected
branch/branches.
Figure 8-51 Utilization Across Product Types

- Objective – To highlight the total credit line
amount and utilized amount by different product types for selected
branch/branches.
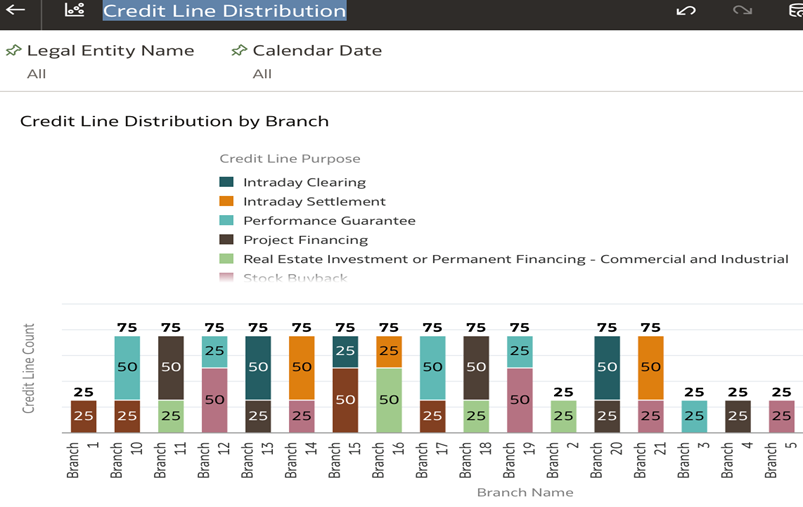
- Credit Line Distribution: The Visualization provides insight
into the predominant credit line purposes at each branch allows a bank to tailor
its products to better match local demand. This helps management to assess the
commitment track to aid in performance review and Risk management.
- Objective – To view number of credit lines by credit
line purpose for each branch within the legal entity.
Figure 8-52 Credit Line Distribution

- Objective – To view number of credit lines by credit
line purpose for each branch within the legal entity.
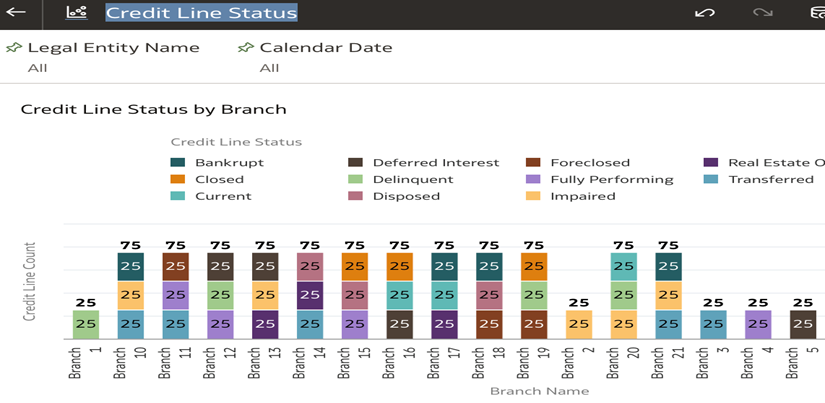
- Credit Line Status: The dashboard illustrates the segregation of credit lines into various credit status categories such as fully performing, delinquent and impaired. This helps Banks to quickly identify areas of concern, particularly the proportion of non performing or delinquent accounts. This allows for early intervention strategies to be deployed, such as reaching out to customers who are falling behind on payments to offer restructuring or support services that might prevent further delinquencies.
- Activity - Results Data Browsing
- Objective – To view number of credit lines by credit line status like
fully performing, delinquent, impaired for each branch within the legal
entity.
Figure 8-53 Credit Line Status

- Objective – To view number of credit lines by credit line status like
fully performing, delinquent, impaired for each branch within the legal
entity.
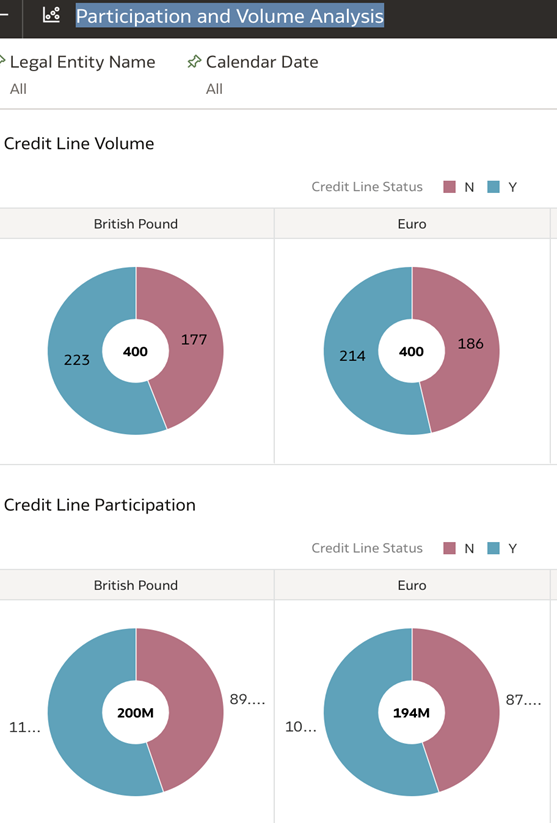
- Participation and Volume Analysis: The visualizations show the
participation flag for credit lines alongside the sum of total credit line amounts
tagged with that flag which helps banks in analyzing how participation in specific
credit programs impacts their overall credit portfolio. Participation flag indicates
if the credit line facility is a part of the syndication.
- Objective – To highlight the total credit line amounts and
Participation counts by Legal entity and Calendar date.
Figure 8-54 Participation and Volume Analysis

- Objective – To highlight the total credit line amounts and
Participation counts by Legal entity and Calendar date.