16.1.4 Data Quality Exception Report
Populating Data for DQ Exception Report (Data Quality Dashboard)
Before verifying the Data Quality Exception Report dashboard (DQ Dashboard), follow these steps:
- Navigate to Operations and select Batch Execution.
- Select the DGS_DQ_CTL_BATCH batch. See OFS Data Governance Run Chart for
more details.
Note:
TheFSI_DGS_DQ_BALANCE_COL_MAPtable will have the configuration details required for DQ-Exception amount calculations.Ensure that Account Mapper Batch is executed before you execute the DGS_DQ_CTL_BATCH.
Table 16-1 Data Quality Exception Report
| Column Name | Description |
|---|---|
| V_DQ_STG_TBL | Column to store Stage Table Name |
| V_DQ_STG_BAL_AMT_COL | Column to store Data Quality Exception Balance Column to be used for DQ-Exception Amount Calculations |
| V_PK_REFERENCE_COL | Column to store Primary Key of the Stage Table |
Table 16-2 Data Quality Exception Report
| V_DQ_STG_TBL | V_DQ_STG_BAL_AMT_COL | V_PK_REFERENCE_COL |
|---|---|---|
| STG_BORROWINGS | N_EOP_BAL | V_ACCOUNT_NUMBER |
| STG_CARDS | N_EOP_BAL | V_ACCOUNT_NUMBER |
| STG_CASA | N_EOP_BAL | V_ACCOUNT_NUMBER |
| STG_COMMITMENT_CONTRACTS | N_COMMITMENT_AMT | V_CONTRACT_CODE |
| STG_CREDIT_LINE_DETAILS | N_LINE_UTILIZED_AMT | V_CREDIT_LINE_CODE |
| STG_FORWARDS | N_EOP_BAL | V_CONTRACT_CODE |
| STG_INVESTMENTS | N_EOP_BAL | V_ACCOUNT_NUMBER |
| STG_LC_CONTRACTS | N_EOP_BAL | V_CONTRACT_CODE |
| STG_LEASES_CONTRACTS | N_EOP_BAL | V_ACCOUNT_NUMBER |
| STG_LOAN_CONTRACTS | N_EOP_BAL | V_ACCOUNT_NUMBER |
| STG_OD_ACCOUNTS | N_EOP_BAL | V_ACCOUNT_NUMBER |
| STG_REPO_CONTRACTS | N_EOP_BAL | V_CONTRACT_CODE |
| STG_TD_CONTRACTS | N_EOP_BAL | V_CONTRACT_CODE |
| STG_ACCT_RECOVERY_DETAILS | N_PRIN_RECOVERY_AMT | N_PRIN_RECOVERY_AMT |
| STG_ACCT_WRITE_OFF_DETAILS | N_PRIN_WRITE_OFF_AMT | V_ACCOUNT_NUMBER |
Note:
Before running theDGS_DQ_CTL_BATCH, ensure the required
configuration details are updated and available in the
FSI_DGS_DQ_BALANCE_COL_MAP table.
The enhanced Data Quality Control functionality analyzes the impact of Data Quality failure on Regulatory Reporting based on Data Source. The report helps analyze the impact of Data Quality failure on a Cell value, and there is an option to drill down to account granularity to identify failed accounts. The analysis provides a Dashboard, Summary report, and Data Quality drill down report.
The following are the reports provided under Impact Summary.
- Impact Summary – Data Quality Impact Detail
- Click the Data Quality Map or the Stage Entity, to view the Impact Analysis.
Figure 16-13 Impact Summary
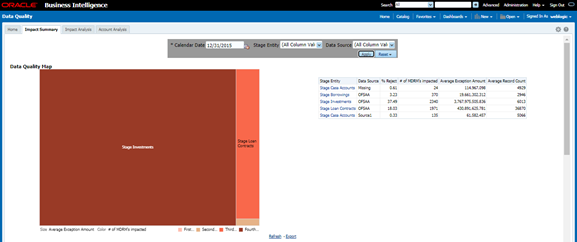
Figure 16-14 Data Quality Impact Detail
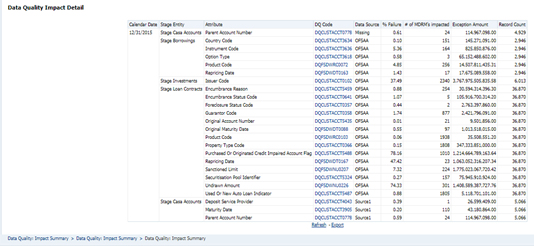
Figure 16-15 Impact Analysis
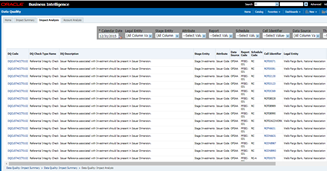
Figure 16-16 Account Analysis
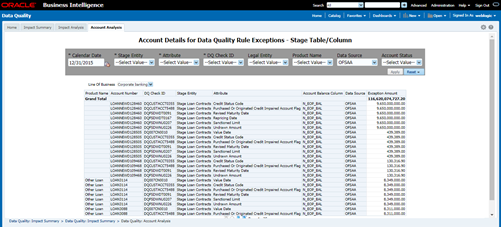
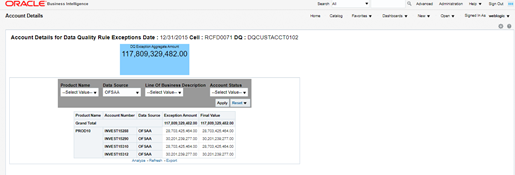
Figure 16-17 Account Details
