16.1.3 Distribution of Defaults by Attribute Count
This analysis displays the distribution of default records based on the attribute count.
Figure 16-10 Distribution of Defaults by Attribute Count

Click either the pie chart or bar graph to get a drill down which displays the following details:
- Entity
- Attributes
- DQ Check Type Name
- Percentage of Rejected Records Count
- No. of Failed Attributes
Click Attributes to display the following:
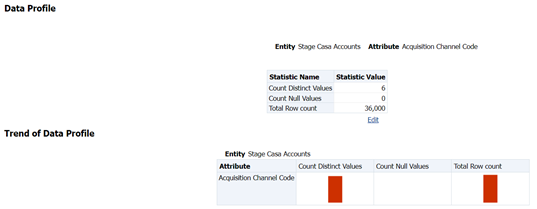
- Data Profile: It displays two analyses:
- Data Profile: A tabular representation of the following data based on
Entity-Attribute Name:
- Count Distinct values
- Count Null Values
- Max Value
- Mean Value
- Minimum Value
- Outliers – Greater than 2x mean
- Outliers – Less than 2x mean Total Row Count
Figure 16-11 Data Profile

- Trend of Data Profile: Graphical representation of the following data based
on the Entity-Attribute Name:
- Count Distinct values
- Count Null Values
- Total Row Count
- Data Profile: A tabular representation of the following data based on
Entity-Attribute Name:
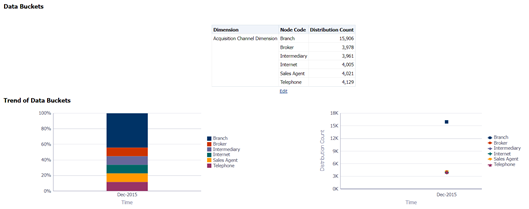
- Data Bucket: It displays two analyses:
- Data Bucket: The tabular representation of the following data based on the
Dimension Table:
- Node Code
- Distribution Count
Figure 16-12 Data Buckets

- Trend of Data Bucket: A graphical representation of the Distribution Count
and Node Codes against time intervals. The Trend of Data Buckets includes
two types of graphs:
- Bar Graph
- Line Graph
- Data Bucket: The tabular representation of the following data based on the
Dimension Table: