6.2 Region Navigation
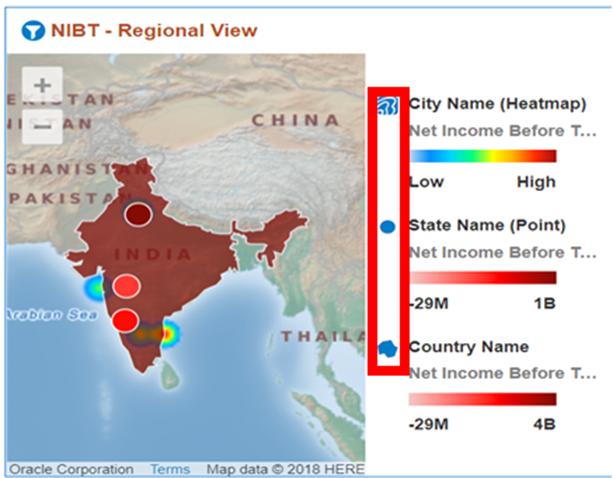
The Region Canvas opens with a map. The map has three layers – Country, State, and City. The user is expected to select the layer by clicking the icon next to Country, State, and City as indicated in the following illustration. The icons are highlighted in the red rectangle.
Figure 6-3 NIBT – Regional View

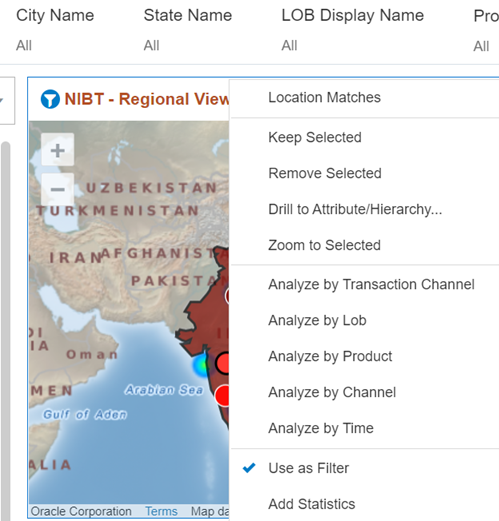
After the region is selected, the user can look at the reports for the selected
geographical location and even navigate to other canvases, where the regional context is
passed.

Figure 6-4 NIBT – Geographical Location View
