ECL Reconciliation Analysis for Credit Line or Facilities
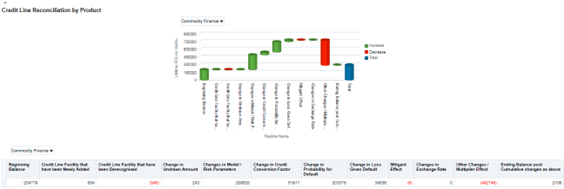
This report is a waterfall chart providing a visual description of the movements between two reporting dates. The tabular report is located following the waterfall chart that details various contents of the chart.
- The first and the last columns represent the run1 and run2 ECLs respectively.
- Across the x-axis, factors are grouped based on similarity and provide a high view of reasons for changes between the runs. A group can further have individual contributing factors, the summation of their combined net effect per group is shown as a column on the waterfall chart.
- A red column indicates the ECL increased between the two runs and green indicates a reduction in ECL.
- If there are no columns visible for a group, say in as Derecognized Assets in the sample image as follows, it means that either constituent factors movements have canceled each other out or as a group, they did not impact in increase or decrease in ECL.
The below report displays only the lifetime ECL on Undrawn Amount data.

Figure 13-6 The ECL Reconciliation Analysis Report
