Health
Click Health icon to view the application status and version details. The Health page consists of four tabs:
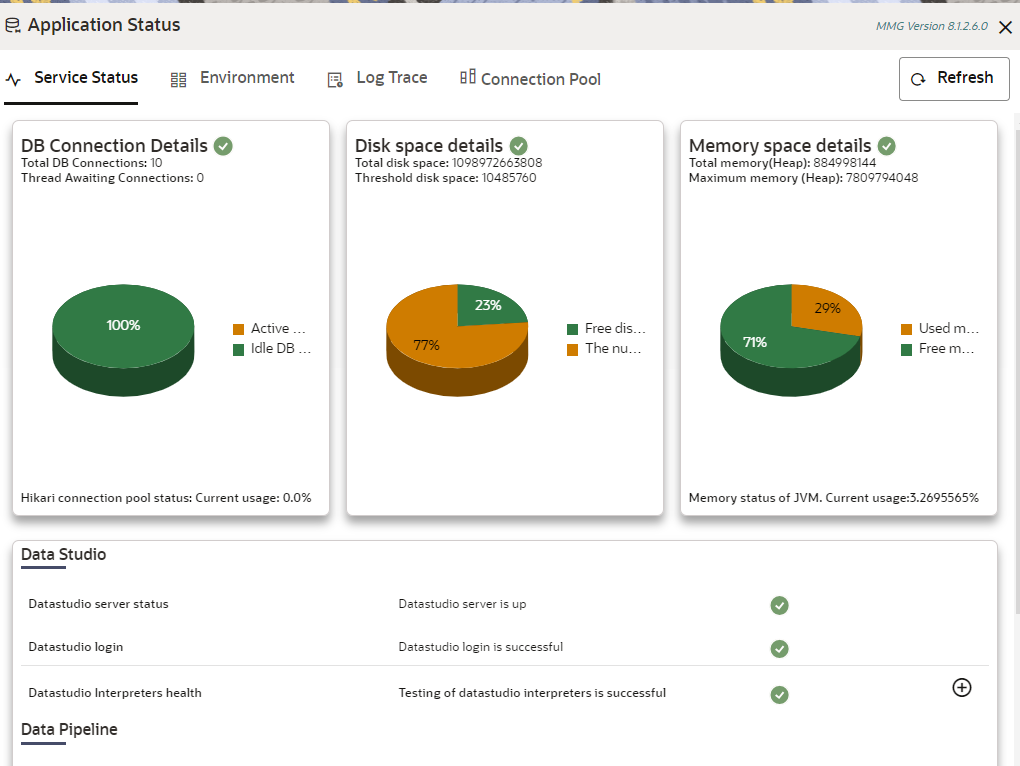
Figure 4-2 Application Status

- Service Status:The Database connection, Disk
space, Memory allocation details are displayed in graphical chart format. Hover
on the chart to view more details. In addition, the status information of the
services that are running such as Data Studio, Data Pipeline, and Graph Services
are displayed. Click on the + icon to view individual services status.
Note:
The Data Pipeline Service Health status is displayed as "Not healthy" when the response is other than "UP" status. You must be mapped to the Graph role 'GRPSUM' as the Data Pipeline Health check is present in Graph services. - Environment: The System and Application properties details are displayed.
- Log Trace: The individual logs are displayed
that will help you during analysis and debugging of the issue. You can set the
last lines of the log based on your requirements. For example, if you wish to
see only 10 last lines of the log, enter 10 in the Show last lines text box. By
default, the files are displayed in alphabetical order and
mmg-service.log is displayed. Click on the required
log file to view specific details.
Note:
Access logs are available in the following location for UI and Services.$LOG_HOME/services/access/mmg-ui-access.log
$LOG_HOME/services/access/mmg-service-access.log
- Connection Pool: The information of
connections used for the data source are displayed. Select the data source from
the drop-down list to view the connections and the maximum capacity. This will
help you in monitoring the connections of the specific data source.
Clicking on the Refresh icon will refresh the application status details.