5.6.1.7 Segment Income Statement
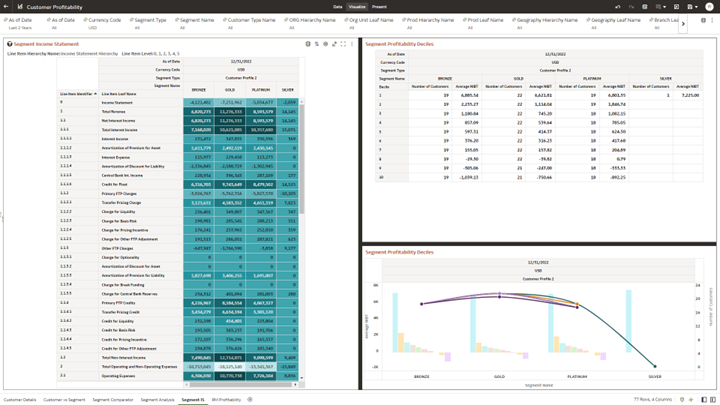
In this dashboard, Detailed Income Statement at Segment Level (for all Segments within selected Segment Type, as defined by the user) can be viewed.
Figure 5-169 Canvas Segment Income Statement

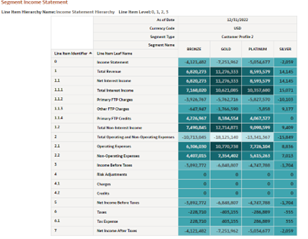
Report : Segment Income Statement: This view provides
Detailed Segment level Income Statement in same format, as can be seen in other detailed
income statements.

Figure 5-170 Report : Segment Income Statement

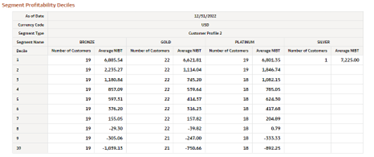
Table Segment Profitability Deciles: For a selected Segment type,
the profitability deciles table show the customer distribution across the different
segments and shows income generated by customers of these segments in a decile view, the
top decile showing the most profitable customers of the segment. This # customers and
average NIBT can be compared across segments for the selected segment type.

Figure 5-171 Table Segment Profitability Deciles

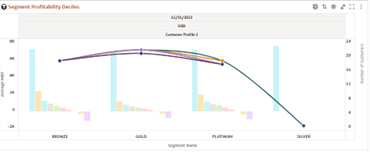
Canvas Segment Profitability Deciles: For a selected Segment type,
the profitability deciles chart, visually shows the customer distribution across the
different segments and shows income generated by customers of these segments in a
decile, the top decile showing the most profitable customers of the segment. This #
customers is shown by the line chart and average NIBT shown by the bars in this double
axis chart.

Figure 5-172 Canvas Segment Profitability Deciles
