8.2 Top 10 Allocation Run Times
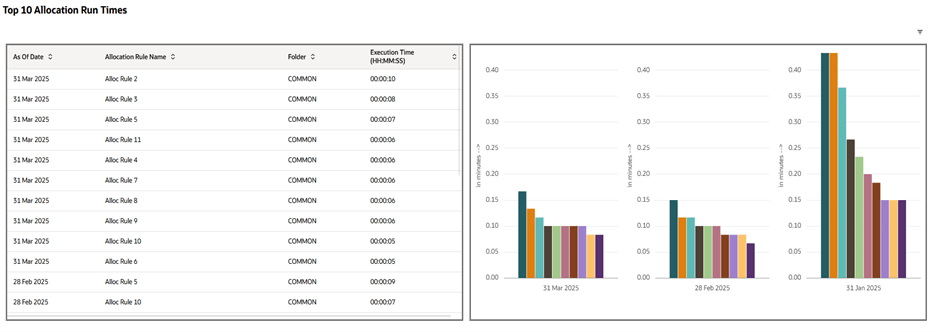
This widget shows a table and a chart adjacent to each other. The widget looks like the following:
Figure 8-2 Top 10 Allocation Run Times

The table on the left hand side showing columns As Of Date, Allocation Rule Name, Folder, Execution Time. The table lists the top ten most time consuming allocation rules in the last three consecutive As-of-date allocation runs. This means the table ideally should always list 30 rows that corresponds to the 10 most time consuming allocation rule executions in each of the last three consecutive As-of-date executions. The table can list less than 30 rows when any As-of-date execution has resulted into less than 10 rule executions.
This table helps the users to identify the slowest running rules for the most recent three As-of-date executions allowing for user analysis of slowness in execution and to take corrective action if needed.
The rules are default sorted by the As-of-date and the Execution Time in decreasing order of the As-of-date and the Execution Time values. The Execution Time are reported in HH:MM:SS format denoting the appropriate figures in hours, minutes and seconds.
Individual column sorting option is provided at each column level through the column header.
The widget has a filter option at the top right corner allowing to filter table data and chart data either by As-of-date or by allocation rule names. The filter is shown in the following screen shot with the red colored square.
Figure 8-3 Top 10 Allocation Run Times

The right hand side of the widget contains a bar chart of the execution time (in minutes) for each allocation rule executed per As-of-date.
The height of each bar corresponds to the allocation rule execution timing represented in minutes, while the color of each bar helps to distinguish among different allocation rules.
The chart holds three separate groups of bar-charts, each group representing each executed As-of-date. The bar-chart for the most recent executed As-of-date appears on the left most side, followed by the earlier As-of-date execution in the middle and finally the earliest one appearing on the right most side.
The chart holds exactly the same data as the table. The chart should ideally hold 30 bar graphs always, each set of 10 corresponding to each executed As-of-date. The chart can list less than 30 rows when any As-of-date execution has resulted into less than 10 rule executions.
The bar chart serves the same purpose as the table information but the chart gives an additional visual representation of the slowest running rules for each As-of-date.
Similar to the table, the chart can be filtered either by As-of-date or by allocation rule names through the same filter option explained earlier.