3 Dashboard

The Dashboard consists of tiles that summarize data for locations, devices, and transaction posting performance.

Tip:

To see a larger version of an image, right-click on the image to open it in a new browser tab.

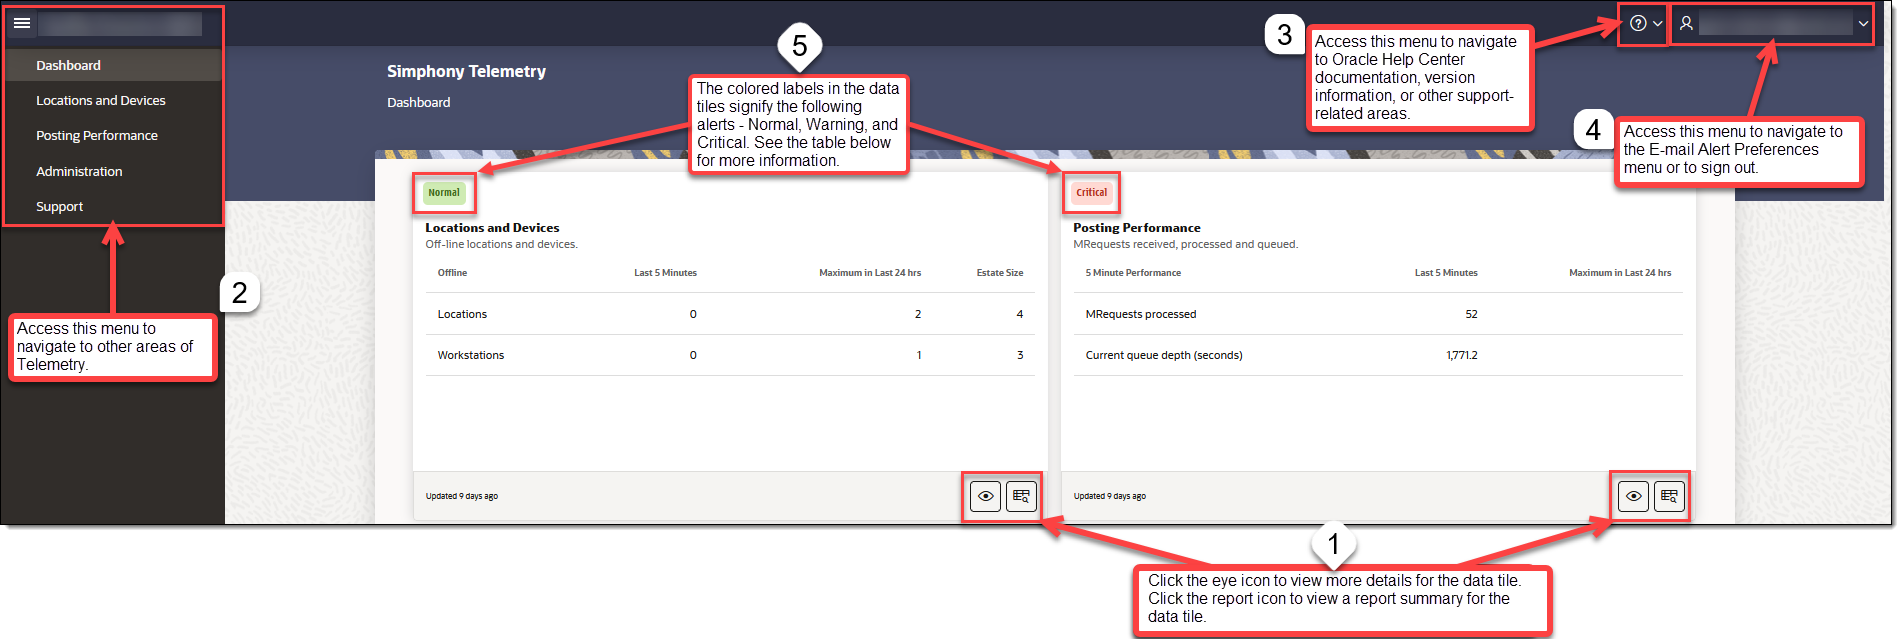
Figure 3-1 Dashboard View

This image shows the dashboard of Simphony Telemetry, displaying several information tiles, data, and an expanded side menu.

Dashboard Tasks

The following table explains how to complete tasks on the Dashboard:

Callout Number Task Procedure

1

View details

  1. Navigate to a data tile.

  2. Click the Eye icon (This image shows the eye icon.) in the bottom-right corner of that tile, to view a detailed dashboard relevant to that data.

1

View report summary

  1. Navigate to a data tile.

  2. Click the Report icon (This image shows the report icon.) in the bottom-right corner of that tile, to view a report summary relevant to that data.

2

Navigate to other areas of Telemetry

  1. Click the menu (This image shows the home page menu icon.) in the upper-left corner.

  2. From the drop down menu, click the desired area to navigate to.

3

Access the Help menu

  1. Click the Help icon (This image shows the help menu icon) in the upper-right corner.

  2. In the drop-down menu:
    • Click Help to access Oracle Help Center documentation.

    • Click About to access Telemetry version information, and other general Oracle related information.

4

Access the Profile menu

  1. Click the Profile drop-down menu in the upper-right corner.

  2. In drop-down menu:

    • Click Preferences to set your e-mail alert preferences. See E-mail Alert Preferences for more information.

    • Click Sign Out to sign out of Telemetry.

5

Alert Labels

The alert labels in the data tiles signify the following:
  • For Locations and Devices:
    • If locations are offline/have no internet for 1 hour or longer, a warning status is displayed. If locations are offline/have no internet for 24 hours or longer, a critical status is displayed.

    • If more than 20% of workstations are offline for 4 hours longer, a warning status is displayed. If more than 20% of workstations are offline for 24 hours or longer, a critical status is displayed.

  • For Posting Performance, alerts are sent if the following queue depth (the approximate amount of time in seconds it will take to process all pending requests) thresholds are met:
    • Normal = 0–90

    • Warning = 90–300

    • Critical = 300+