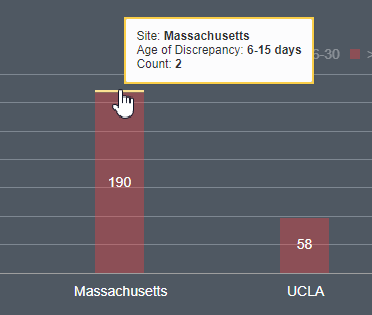
Discrepancies by Age graph
In the Age graph, each bar represents a site and the colors within the bar represent the age range of the discrepancies.
The Age graph is filtered by "Since Last Opened" by default, but can be changed to display discrepancies filtered by "Since Last Answered" using the drop down menu above the graph.
If you position your cursor anywhere over the Age graph, you can use your mouse wheel to zoom in and out on the data. The zoom function also supports "pinch" and "expand" gestures on tablets and mobile devices. The Age graph features a zoom and scroll component at the bottom that lets you scroll across the data on the x-axis when there are too many sites to show on the initial screen.
| Color | # of Days Since Discrepancy Change |
|---|---|
| Green | 0-5 |
| Yellow | 6-15 |
| Orange | 16-30 |
| Red | >30 |
Clicking on any of the bars within the Age graph takes you to the Discrepancies interface where the Discrepancy State Change Date, Site , and Discrepancy State = Open filters have been set according to which bar and age group you clicked.
Parent topic: Use the Discrepancy Dashboard
