View data flow

The data flow diagram shows how clinical data models map to each other. It shows an image of the input model and how the data flowed to the target model (successfully, with errors, or with warnings). This helps you locate areas you may need to troubleshoot.
For more details on viewing the data flow, see this video:
To view the Data Flow Diagram:
  1. After you select a study, click Shows a table with a magnifying glass Data Management in the navigation bar.

    Note:

    To display the data flow, select a study with 25 data models or less. (See Select a study from the Home page for details on selecting a study.)
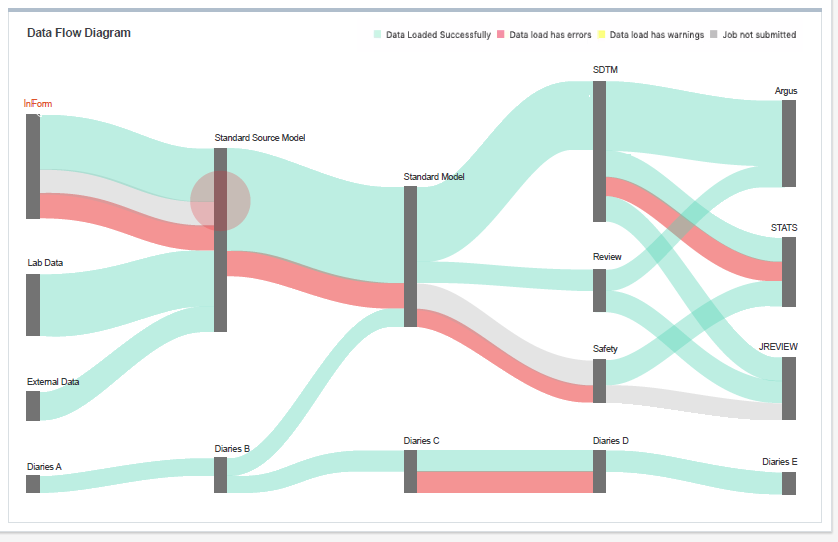
  2. Click Data Flow from the drop-down menu. You see a diagram showing the data flow. The width of the flow paths are proportional to the flow rate.

    For example, you may see something similar to this:

    Shows data flow between models
  3. Review the color of the flows to determine if the data loaded successfully (green path), includes errors (red path), includes warnings (yellow path), or shows light gray (job not submitted).
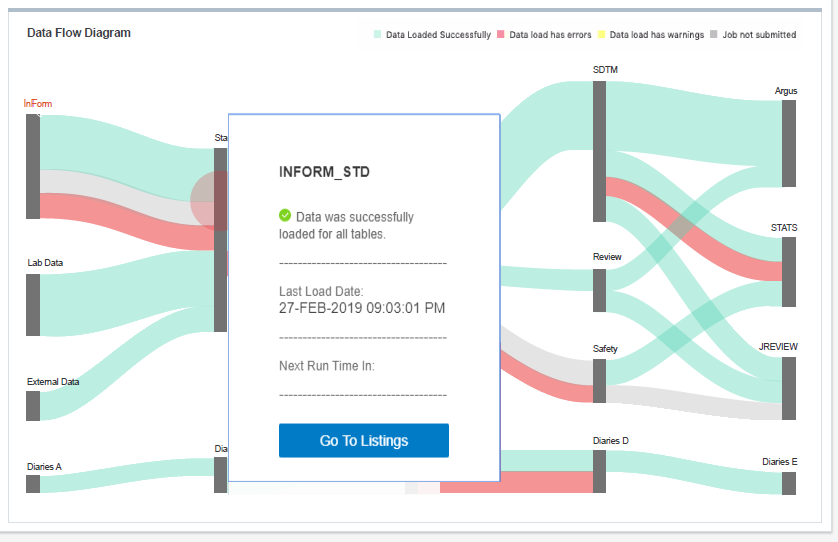
  4. Click on a data model in the data (dark gray, vertical bars) to see more details on the status. For example, if you click an input data model with the area you want to inspect, a dialog box opens with details on the data load, date of the last data load, and next expected run time for the model:
    Shows data flow with details and Got To Listings option

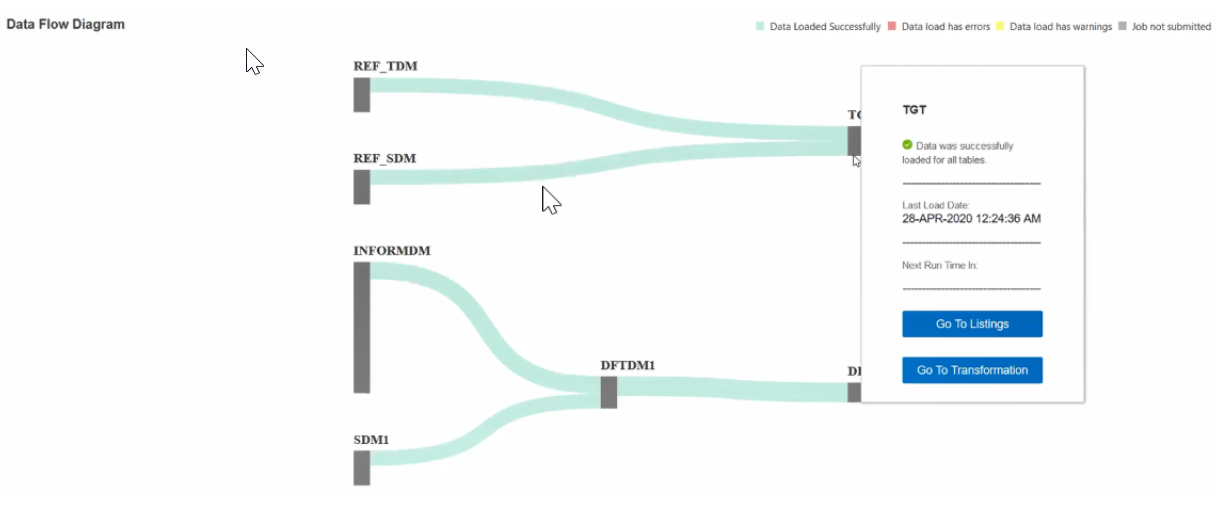
    If you click on a target data model you want to inspect, you may see an additional option. For example:

    Shows data flow with Got To Listings and Go To Transformation options

    Note:

    Depending on the amount of details shown, you may need to use the vertical and horizontal scroll bars to see all the content (if available). And, if the system finds errors (for example, failures when loading data into the data model), the dialog box includes a link to the log file.
  5. If you opened a data model to see details, you may see some or all of the following options:
    • Users with Study Manager roles can click Go To Listings to open the Listings tab and review the data in the appropriate listing. (Click the left arrow icon in the browser toolbar to return to the Data Flow Diagram page.)
    • Users with Study Configurator roles, can click Go To Listings to open the Listings tab or Go To Transformation to open the Transformation tab in Study Configuration (for the current lifecycle). The tab opens with the source and target tables used in the transformation for the target data model. (Click the left arrow icon in the browser toolbar to return to the Data Flow Diagram page.)
    • Users with the DMW Exclude Internal Datamodel from Listings in Production role can click Go To Transformation to open the Transformation tab in Study Configuration if they select an InForm internal data model in the data flow. But, they cannot access the Go To Listings option.
    • If available, click Log to download the log file and see details on any errors.

    Note:

    Click anywhere in the Data Flow Diagram title bar to close the data model dialog box.
  6. Click any main menu button in the navigation bar to exit the Data Flow Diagram page.