Clinical Dashboard
The Clinical dashboard contains the following pages:
Summary
Figure 2-9 Summary Page

You can use the filters at the top of the page to focus on preferred organization providers, physicians, or calendar years. The page has the following reports:
- Overview - An overview of counts in a hospital enterprise including the number of
patients, discharges, emergency department patients, inpatients, and outpatients.
This helps you to compare the inflow and outflow of patients, and to allocate
resources based on the distribution of patient care efforts between emergency,
ambulatory and inpatient services.
Click on a number to display a detailed list of all the patients in that category. From there, you can click the patients' MRNs to further drill down their billing details.
- Patients by Admission Type. This report allows you to see the inflow of patients
that go through different admission types (referral, transfer, emergency, etc.) and
to adjust your admission operations accordingly.
Click on a bar to display a detailed list of all the patients in that category. From there, you can click the patients' MRNs to further drill down their billing details.
- Discharges by Diagnosis - Modify this report to show the number of discharges for a
specific diagnosis of interest. You can correlate this report with the Top 10
Diagnoses report and see if they are proportional. If the number of discharges for a
specific diagnosis is trailing, it may indicate a long-term tendency for cases with
that specific diagnosis to accumulate in the organization. You may want to
investigate such situations and address them.
Click on a bar to display a detailed list of all the patients with that diagnosis. From there, you can click the patients' MRNs to further drill down their billing details.
- Encounters by Organization. This report allows you to see the workload distribution between your organizations and plan your staffing, budgeting, and resource allocations accordingly.
- % of Encounters by Diagnosis - Modify this report to show the % of encounters for a specific diagnosis of interest. You can use this report to estimate the mix of specialists that you need, based on the workloads that the various types of treatments require.
- Encounters by Type - The balance between the inpatient and outpatient services you provide may help your organization adjust its focus either on clinics or hospitals.
- Top 10 Diagnosis - Modify this report to show the number of encounters for a
specific diagnosis of interest. You can use this report to see which treatments that
you provide are the most labor intensive.
Click on a bar to display a detailed list of all the patients with that diagnosis. From there, you can click the patients' MRNs to further drill down their billing details.
- Discharges by Year-Month - You can correlate this report with the number of encounters by year-end and see if there are any seasonal slow-downs in treatment delivery.
- Encounters by Year-Month - You can use this report to see the long-term trends and seasonal spikes in workload.
- Discharges by Ethnicity - Shows a comparative analysis of number of discharges over two years by ethnicity. Modify this report to show the number of discharges for specific years of interest. You can correlate this report with the number of encounters by ethnicity to see if there is a systematic tendency to discharge members of certain ethnic groups after fewer investigations than the baseline.
- Encounters by Ethnicity - Shows a comparative analysis of the number of encounters over two years by ethnicity. Modify this report to show the number of encounters for specific years of interest. You can correlate this report with the number of discharges by ethnicity to see if there is a systematic tendency to discharge members of certain ethnic groups after fewer investigations than the baseline.
- Encounters by Gender - Shows the workload distribution between male and female patients. You can use this report to plan gender-specific healthcare measures.
Parent topic: Clinical Dashboard
Stroke Encounters
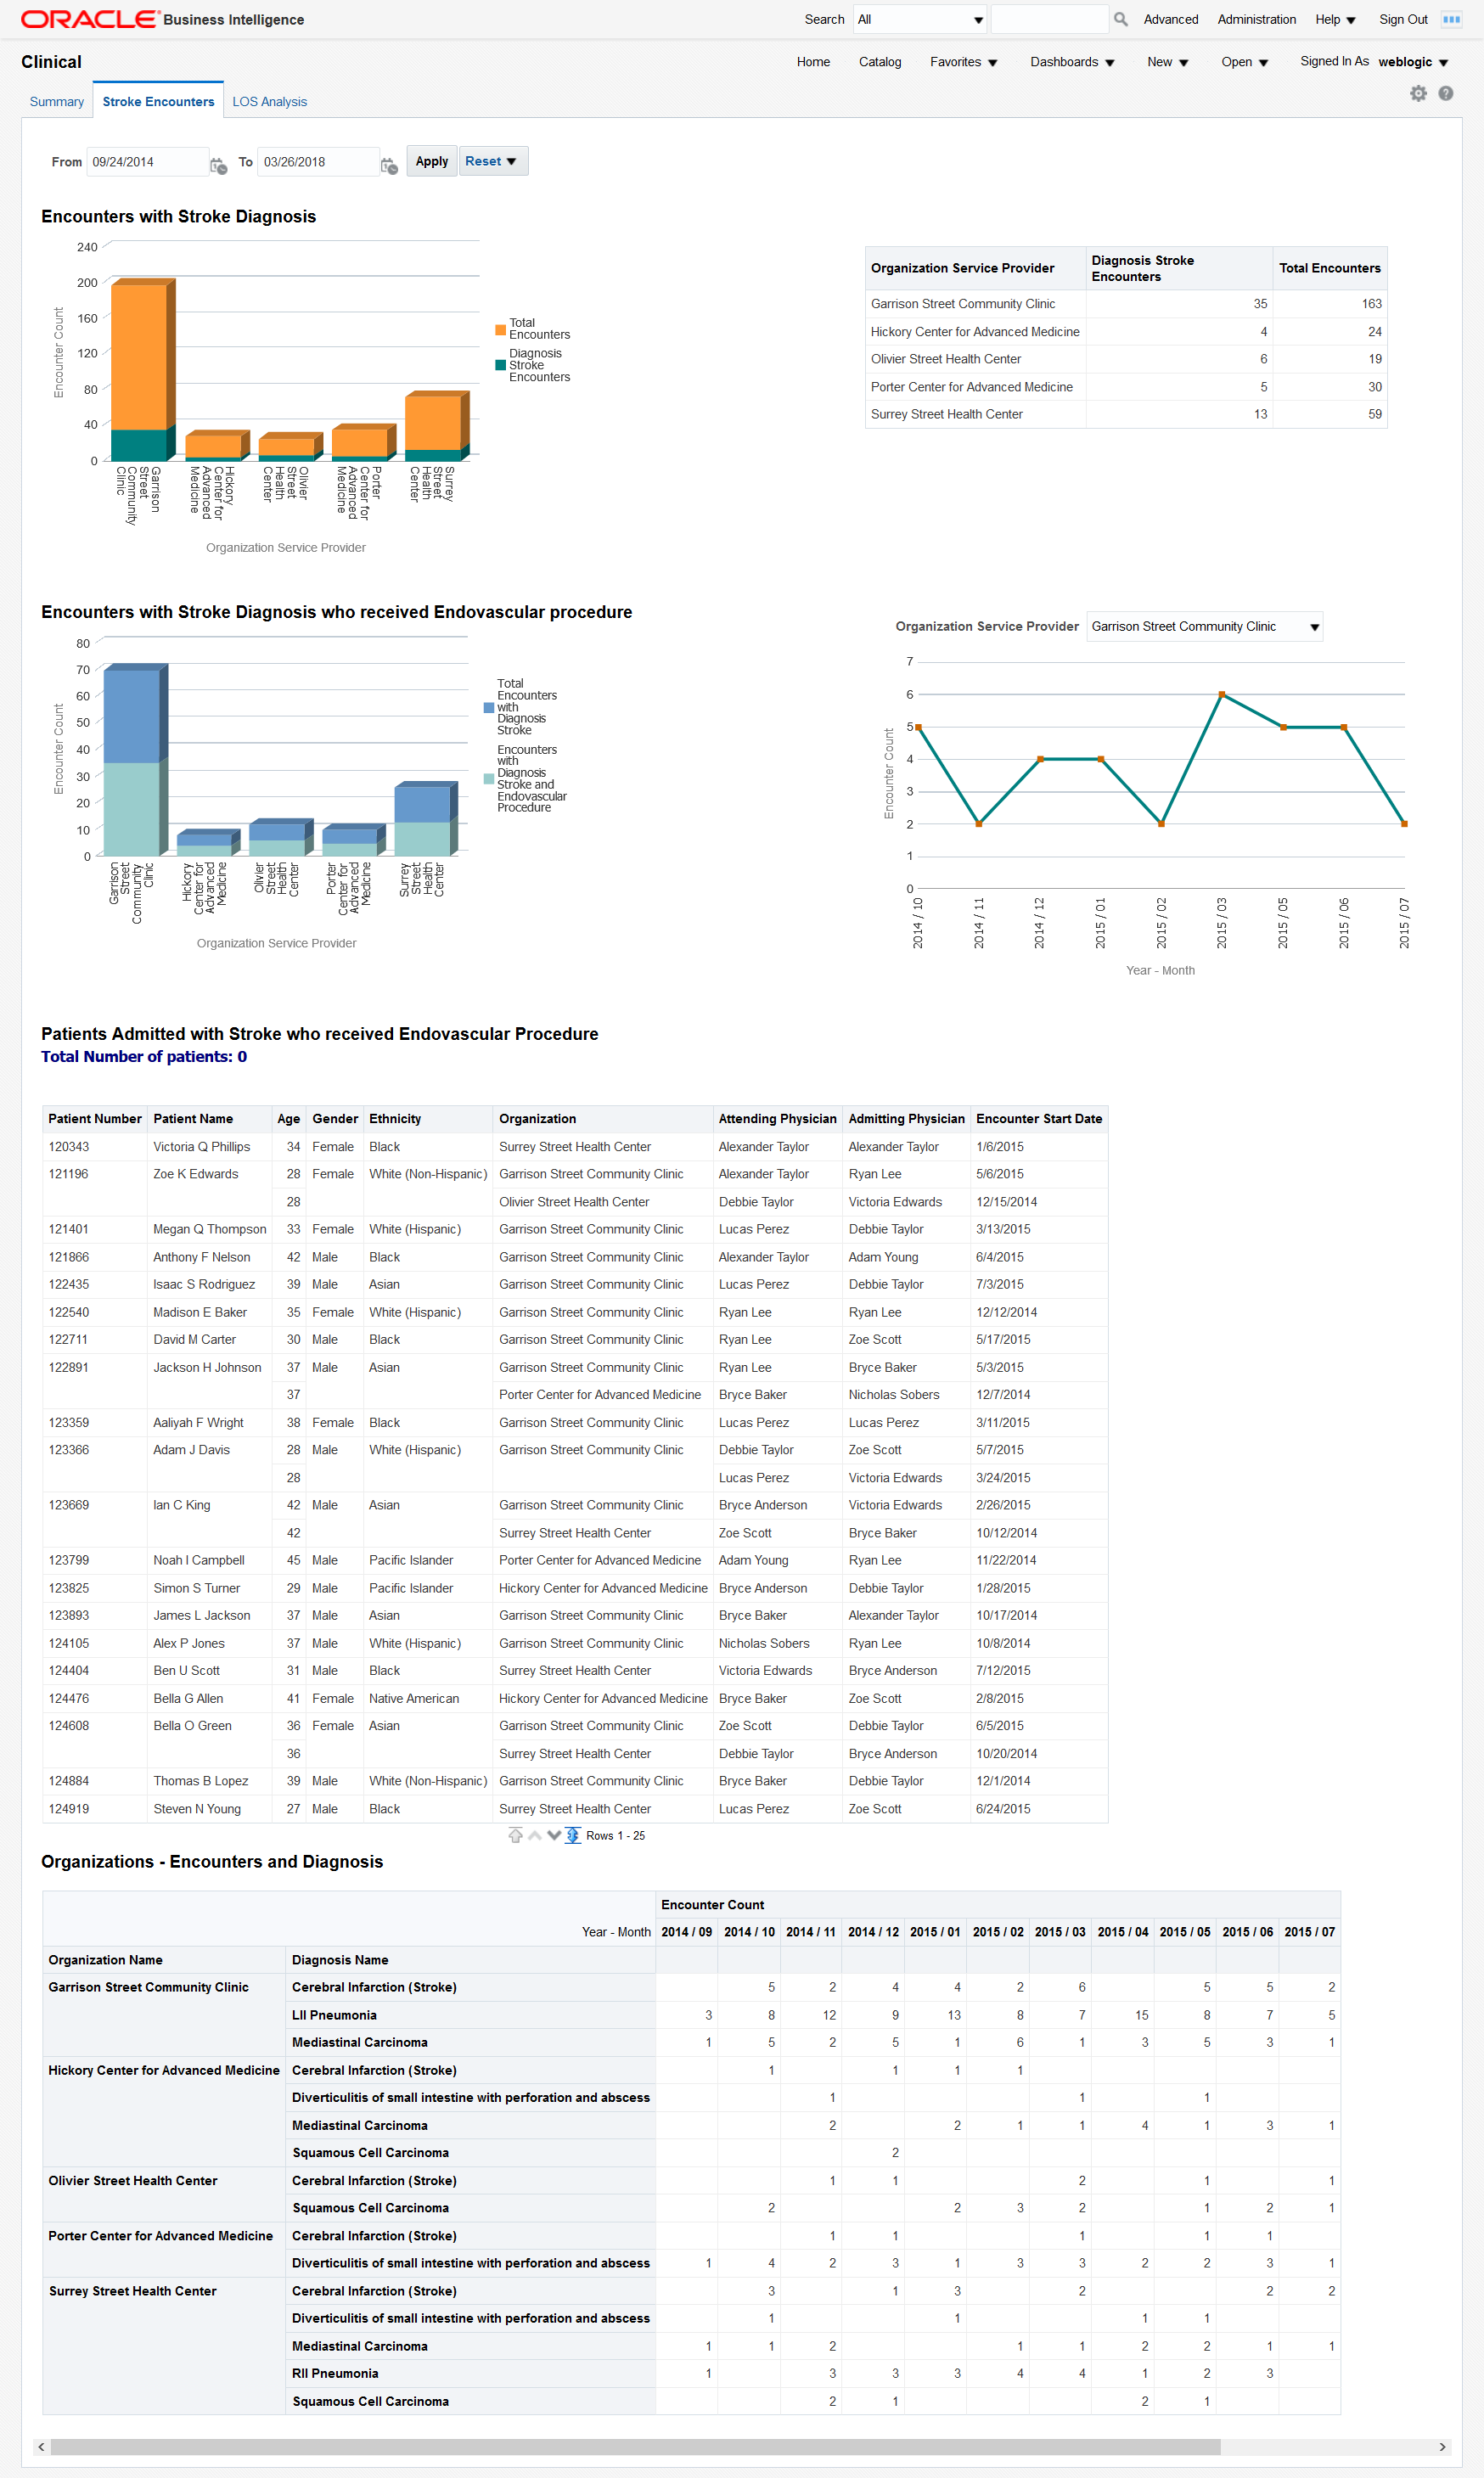
The Stroke Encounters page shows a holistic view of the number of encounters in a Healthcare organization for different dimensions such as diagnosis, procedure, and time. It uses the Stroke diagnosis and Endovascular procedure subject areas. You can modify the page to use any diagnosis and procedures based on your use case.
Figure 2-10 Stroke Encounters Page

You can use the filters at the top of the page to focus on specific time periods. This page has the following reports:
- Encounters with Stroke Diagnosis - Shows the total number of encounters with stroke diagnosis in an organization against the total number of encounters. This lets you compare and contrast the volume of encounters in your organizations for a specific diagnosis.
- Encounters with Stroke Diagnosis who received Endovascular procedure - Shows the
number of encounters with stroke diagnosis and the patients who received
endovascular procedure treatment. This lets you evaluate the frequency of
endovascular procedures performed on patients who suffered a stroke.
The chart on the right displays the evolution of the number of encounters for a selected organization during the analyzed time period. This report lets you see long-term trends and seasonal spikes for endovascular procedures performed on patients who suffered a stroke.
- Patients Admitted with Stroke who received Endovascular Procedure - Tabular report showing the list of patients with Stroke diagnosis who have received endovascular procedure for the chosen time period. This report allows you to drill down to the specifics of each encounter attended by individual patients.
- Organizations - Encounters and Diagnosis - Tabular report showing monthly encounters for each diagnosis per organization.
Parent topic: Clinical Dashboard
LOS Analysis
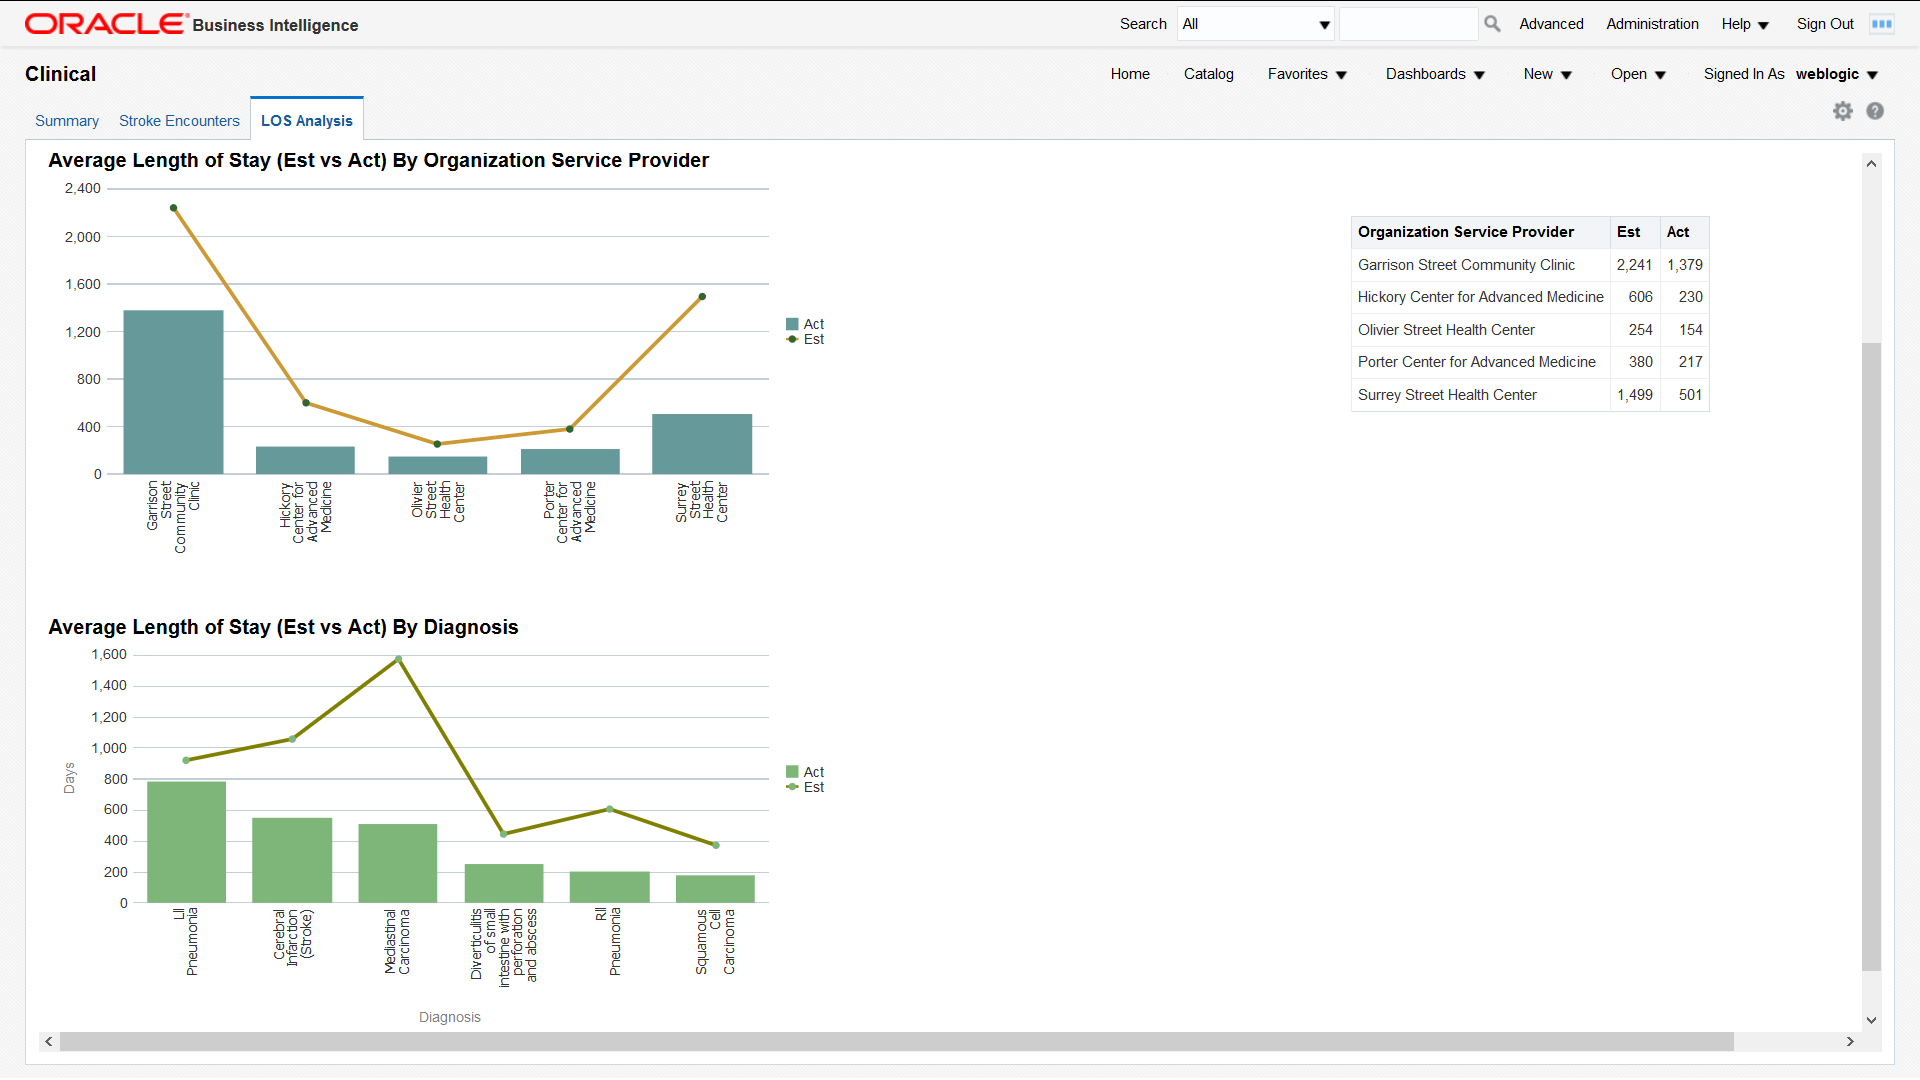
Figure 2-11 LOS Analysis Page

The Length of Stay (LOS) Analysis page has the following reports:
- Average Length of Stay (Est vs Act) By Time - Comparative analysis report that shows the average estimated LOS and average actual LOS over a period of time filtered by organization service provider. You can use this report to analyze and address issues with your LOS forecasting methodology for an organization service provider.
- Average Length of Stay (Est vs Act) By Organization Service Provider - Comparative analysis report that shows the estimated LOS and actual LOS by organization service provider. This report provides insight into the LOS forecasting gaps from each organization service provider.
- Average Length of Stay (Est vs Act) By Diagnosis - Comparative analysis report that shows the average estimated LOS and average actual LOS by diagnosis. You can use this report to analyze and address any issues with your LOS forecasting methodology for individual diagnoses.
Parent topic: Clinical Dashboard