View Cohort Events
The Events List screen provides information about the Patients in the Cohort which was selected in the Cohort List page.
- The upper section of the screen, Cohort Details, which is closed by default and can
be opened using the wedge icon next to the cohort name (such as
 ), provides the following information about the selected Cohort: Name,
Patient Count, Description, Privacy, Owner, Created Date, and Last Updated Date.

- The event list table provides a tabular display of the Patients and their clinical
events. The table supports pagination and also direct navigation to the specified
page.

- The Filter/Funnel icon (
 ) when clicked, displays the sections Show Event Type, Time Scale, and Show
Patients With.

- In Show Event Type, checkboxes are available for each type of clinical event, which can be used to select the clinical events that should be displayed in the event list table. The All Events checkbox can be used to display all types of clinical events. When this checkbox is selected, all other checkboxes are automatically selected and vice versa. If any of the event-specific checkboxes are deselected then All Events is automatically deselected. By default, all of the checkboxes are selected.
- In Time Scale section, the Auto option (selected by default) displays all of the selected event types without applying any filter on their Start Date or End Date attributes. The From option and To, along with the Select Date Type drop down list (with values Start Date and End Date) allow filtering and display of only those events that match with the specified time range, for example the events with Start Date between 01-January-2020 and 31-March-2020.
- The Show Patients With section allows filtering of Events that
match with the filter criteria provided in the input box. Filter criteria
can be defined based on Patient Identifier or the combination of Event Type
(such as Diagnosis, Procedure, and so forth) and Event Name value(s).
Multiple values can be provided in the above input box. Type ahead is provided in this text field. Only one filter type can be provided at a time for this filter.
- Click Apply to apply changes in the Show
Event Type, Time Scale, and Show Patients With sections, refresh the
information in the events list table, and close the above sections.

- Click Reset to restore all of the selections in the above sections to their default selection.
- Click Cancel to close the above sections without applying changes. The information displayed in the events list remains unchanged.
- By default, the Latest Events Only toggle (
 ) is set to display only the latest date's events that are selected for
display, wherein an event is defined by the combination of Event Type and Event
Code. If a particular event has multiple instances on the same date (for example,
Observation of Blood Pressure is performed multiple times in a day) then all of such
instances are displayed. The toggle can be used to change the above filter and
display all of the instances of the selected events.
- Upon clicking a particular event record in the event list table, the
collapsible/expandable sections located at the right side of the events list table
display the details of the patient and the selected event. Depending on the type of
clinical event (such as Diagnosis, Medication, Specimen Collection, and so forth)
the sections display the relevant details of the event using a unique background
color for each section to provide visual cues about different types of events.
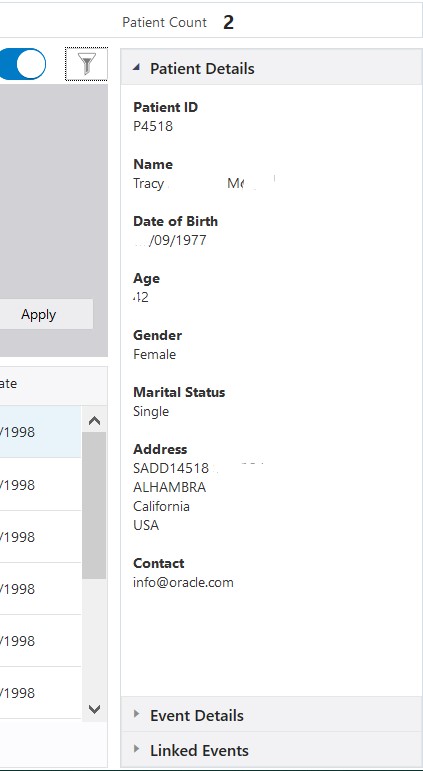
- The Patient Details section displays the demographic and contact details of the selected patient, along with information on the Patient Group(s) associated with the patient.

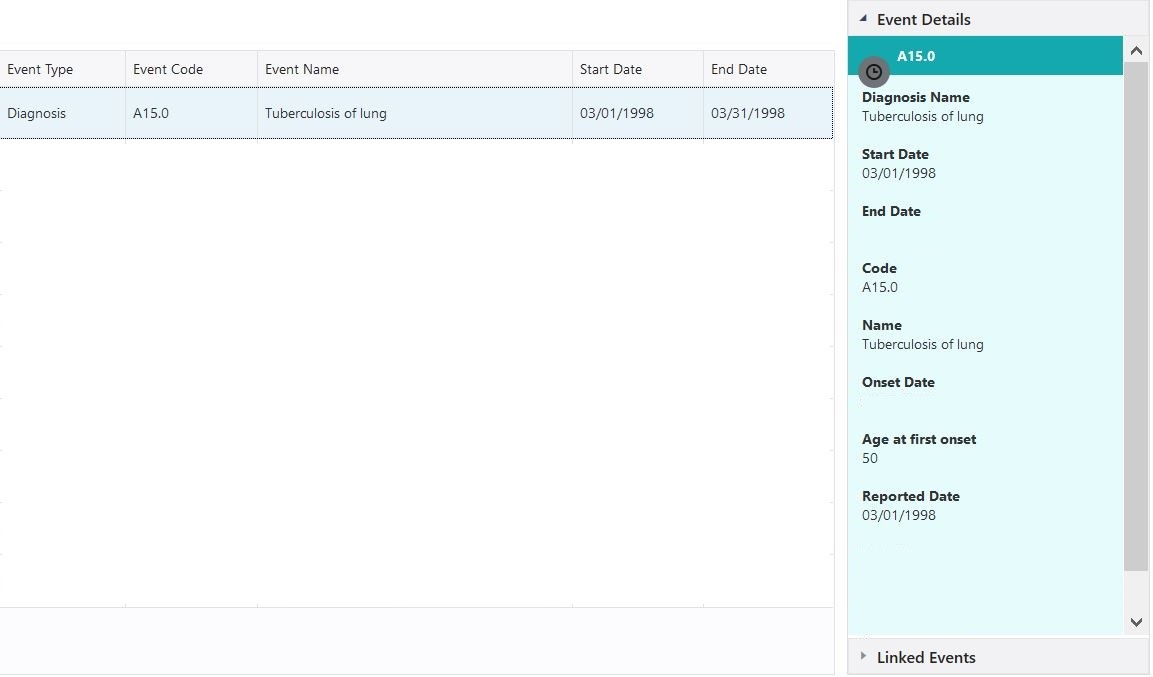
- The Event Details section displays the details of the selected
event.

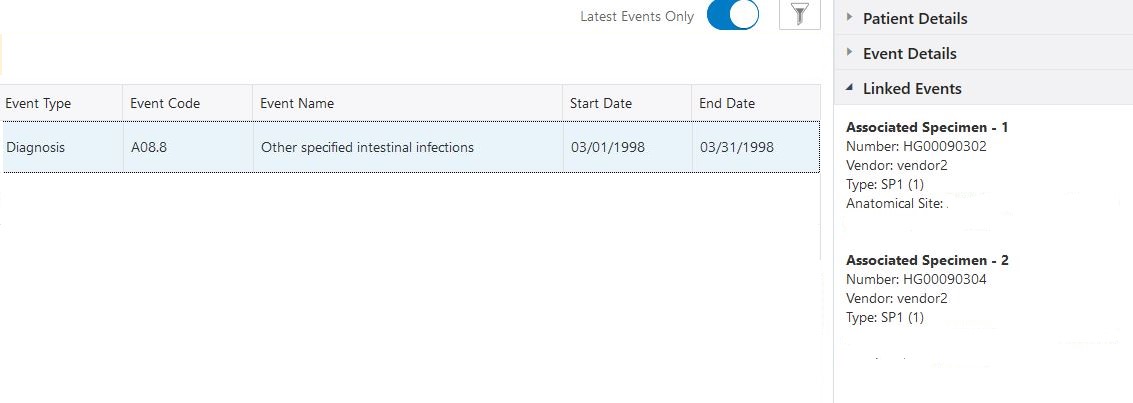
- The Linked Events section is displayed for the clinical events
which can be linked to other clinical events. This section displays details
of all of the events that are linked to the currently selected event in the
events list table.
If a Diagnosis event is selected in the events list table then this section displays details of the Specimen Collection event(s) that are linked to the selected Diagnosis event.
For Medication, Procedure, and Observation events the linked Diagnosis event is displayed.
For Medication, Procedure and Observation events the linked Diagnosis event is displayed. For Medication events the linked Procedure event is also displayed.
For Test or Observation events the linked Specimen Collection event is also displayed.

- The Patient Details section displays the demographic and contact details of the selected patient, along with information on the Patient Group(s) associated with the patient.
- Pagination available at the bottom of this screen allows navigation across multiple
pages of the list. To directly navigate to a particular page, type the page number
in the input box next to the label 'Page' and press 'Enter'
key on the keyboard. However it is limited to the pages that are already loaded and
mentioned in the hover over of the input box, for example the number between 1 and
21 in the image below.

- Click Back to Cohorts to return to the Cohort List screen.
- Click Manage Criteria to go to the Cohort Builder screen.