View Patient Data
The Patient Viewer screen displays the clinical data of an individual patient.
To search for a specific patient:
- In the search input box, (the input box with the text 'Search by patient ID…')
provide the Patient Identifier.

- Click the search icon (
 ) next to the input box or press Enter key on the
keyboard.
Note:
The search for Patient Identifier is based on exact match and it is not case sensitive.
If the application finds a patient with matching Patient Identifier then the screen refreshes and displays the information about the patient, with the Patient ID and Name displayed just below the search input box. If no matching patient is found then a message about no matching results is displayed at the center of the screen.
View Demographics
To view demographic details of the patient:
-
Click on the triangular icon (
 ) adjacent to the Patient ID label.
The demographics section expands to display the demographic attributes for the patient.
-
The Data Studio icon (
 ) provides navigation to the Oracle Parallel Graph AnalytiX (PGX) Data Studio environment.
-
Click the same icon to collapse this section.
Parent topic: View Patient Data
View Clinical Data
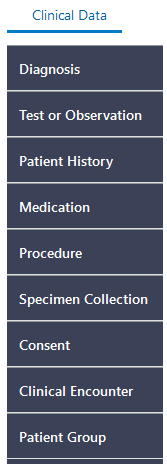
Below the demographics section, the application displays clinical data of the patient in a tabular format in the center of the screen. By default, Diagnosis data is displayed.
To display other type of clinical data in the table, such as Test or Observation, Patient History, and so on:
-
Click the clinical data selection menu available on the left side of the screen.

Parent topic: View Patient Data
Filter Clinical Data
By default the tabular display lists the latest 100 records pertaining to the selected clinical event, sorted by the most recent events displayed first. You can further search or filter for any records for the patient in the system based on the values of specific attributes (columns in the table) and date range of clinical events.
To search and filter the records based on the value of attributes of clinical data:
-
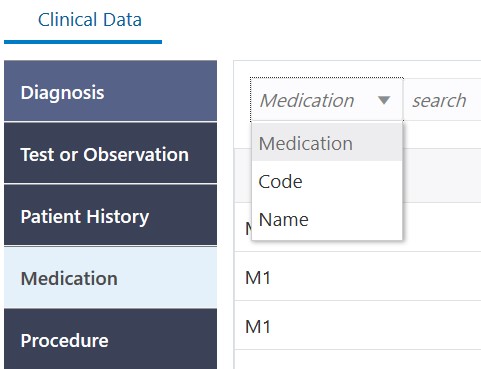
Select the column on which search is required. For example, in the Medication data, to search for the records with a specific medication, select Code or Name from the drop down list.

-
In the search input box next to the column selection provide the search string.
-
Click the search icon (
 ) or press Enter key on the keyboard.
Note:
In the tabular display, search is performed using the operator 'Starts With' and is case sensitive. For example, if the search string "Met" is provided for Code Name, then the tabular data is filtered to display only those records where Medication Name starts with the word "Met". A Medication Name starting with "met" would not be returned.
To filter the records based on dates of clinical events:
-
By default, the table display records without any filter on dates of clinical events, that is, the Time Scale is set to Auto. To filter the records based on the dates of clinical events, for example Medication Start Date or Medication End date, click on the link Auto (
 ).
).
-
In the time range selection dialog, select the desired date range and the clinical event's date column (such as Start Date or End Date) on which the filter is required.

For example, the filter on Medication can be specified to display only those records where Medication End Date is From 01-Jan-2018 To 31-Jan-2019. If only the From date is specified then the filter selects the records where the event date starts at the specified date, for example all records where Medication End Date is equal to or later than 01-Jan-2018.
If only the End date is specified then the filter selects the records where the event date ends at the specified date, for example all records where Medication End Date is equal to or earlier than 31-Jan-2019.
Parent topic: View Patient Data
View Details
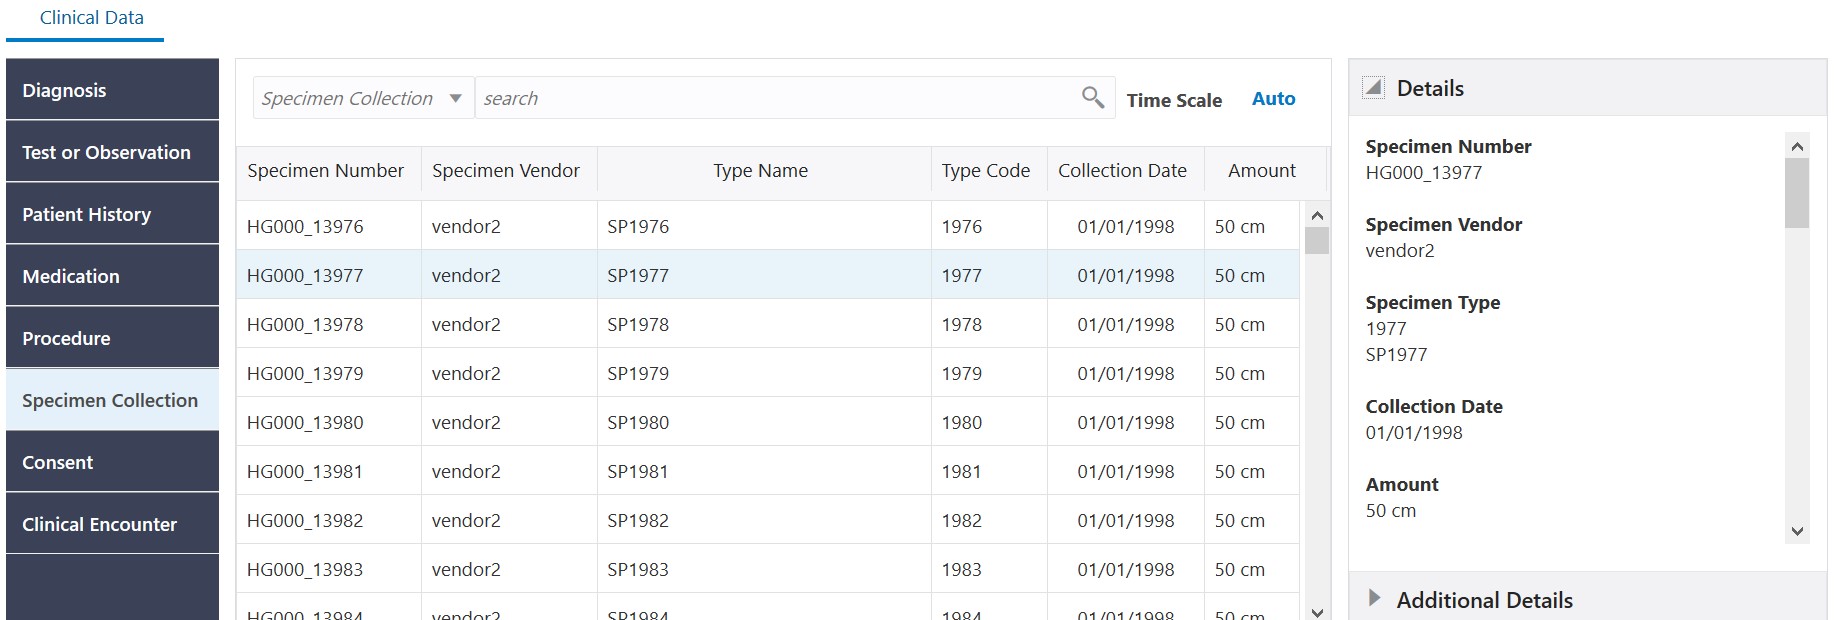
For all types of clinical data (for example, Diagnosis, Procedure, Specimen Collection and so on) the application displays all of the clinical attributes available in Cohort Data Mart in the Details and Additional Details section.
To see the additional attributes available for any selected record in the tabular display:
-
Select the record in the tabular display.
-
On the right side, click Details to expand it (if not already expanded).

-
The Details displays a vertical scroll bar depending on the number of attributes available in this section.
-
Similarly, below the Details section, click Additional Details to display the additional attributes available for the selected record.
The Additional Details section also displays details of all of the events that are linked to the event selected from the events list table.If a Diagnosis event is selected in the events list table then this section displays details of the Specimen Collection event(s) that are linked to the selected Diagnosis event.For Medication, Procedure, and Observation events, the linked Diagnosis event is displayed.For Medication events, the linked Procedure event is also displayed. For Test or Observation events, the linked Specimen Collection event is also displayed.For Specimen Collection events, this section displays information about all of the Specimen Aliases and Specimen Metadata associated with the selected Specimen Collection record.
Parent topic: View Patient Data