View cohort timelines
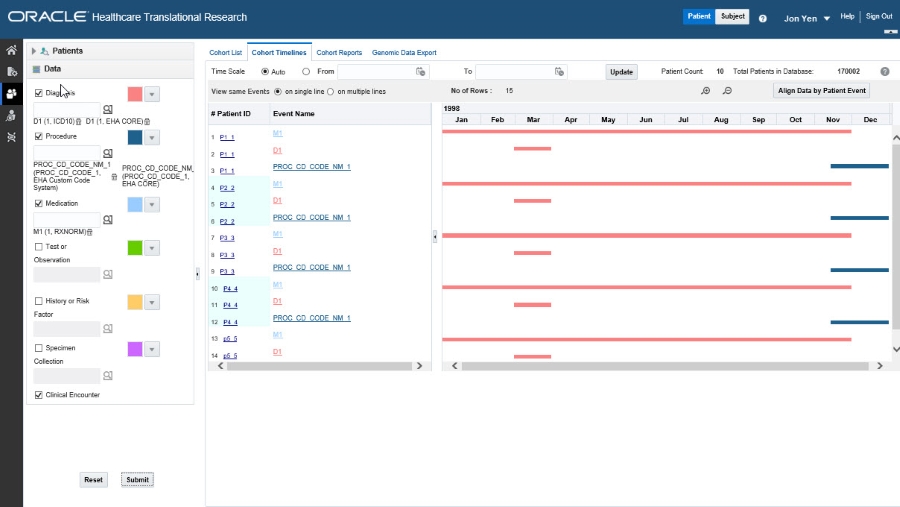
Figure 3-3 A cohort timeline containing data on diagnoses, procedures and medications of patients

For more information, see:
- Select patients or subjects
- Filter data in cohort timelines
- Display patient or subject data
- Select the Timeline Mode
Parent topic: View and maintain cohorts
Select patients or subjects
This step is similar to how you select patients or subjects for the Cohort List.
WARNING:
Don't click Submit yet! Wait until the next section.Parent topic: View cohort timelines
Display patient or subject data
The subject and patient data display is divided into two sections.
- The left side has attributes about the selected patients/ subjects: Patient/ Subject ID and Event Name.
- To see demographic data for a Patient or Subject, hover over their ID.
- The right side shows the colored layers of the selected clinical data, in a timeline view.
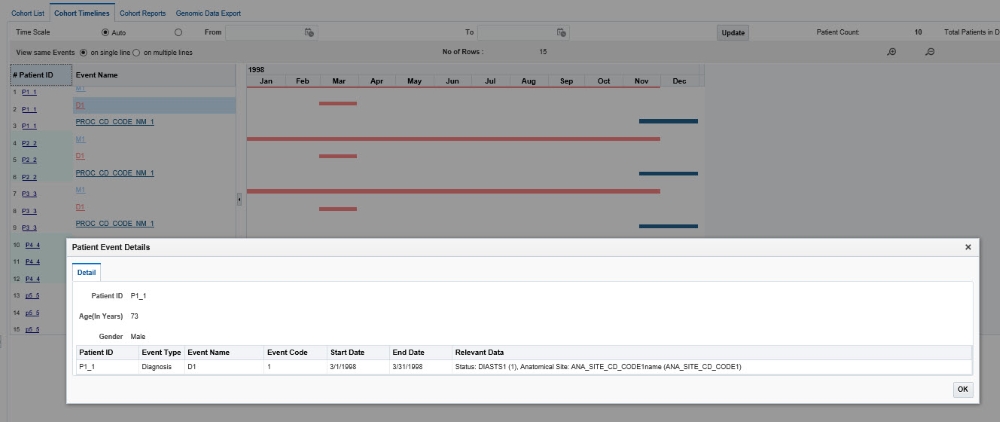
- To see more details of a patient or subject and their medical records, click on an
Event link from the left side table. A pop-up appears
with more data on the event.
Figure 3-4 Event data shown in a pop-up window

- To navigate to the Single Patient Viewer, and see details of a specific subject or patient, click the Subject or Patient ID.
- To view data for a specific date range, along the top, use the Time Scale
options:
- To view data for certain date range, enter the From and To dates and click Update.
- To view data without a specific time reference, select the Auto option.
- For plotting the Observation events, Observation Effective Start Date and
Observation Effective End Date are used as the preferred dates. If these dates are
not available then Observation Date is used. The following decision table is used
for determining the Start Date and End Date for plotting the Observation event on
the chart:
Table 3-1 Data for Plotting Observation Event
W_EHA_OBSV_PATIENT/SUBJECT_H_V Start Date value in Timeline Plot End Date value in Timeline Plot Comment OBSV_EFF_START_DT
OBSV_EFF_END_DT
OBSV_DT
--
--
--
Available
Available
Available/Not Available
OBSV_EFF_START_DT
OBSV_EFF_END_DT
If difference between the two dates is less than 1 Day then for deriving End Date value OBSV_EFF_START_DT plus 1 Day is used.
Not Available
Available
Available
* If OBSV_DT is one or more days(s) prior to OBSV_EFF_END_DT then OBSV_DT is used.* If OBSV_DT and OBSV_EFF_END_DT are on the same day then OBSV_EFF_END_DT minus 1 Day is used.* If OBSV_DT is one or more day(s) later than OBSV_EFF_END_DT then OBSV_EFF_END_DT minus 1 Day is used.
OBSV_EFF_END_DT
--
Available
Not Available
Not Available
OBSV_EFF_START_DT
OBSV_EFF_START_DT plus 1 Day
--
Not Available
Available
Not Available
OBSV_EFF_END_DT minus 1 Day
OBSV_EFF_END_DT
--
Not Available
Not Available
Available
OBSV_DT
OBSV_DT plus 1 Day
--
Not Available
Not Available
Not Available
Null
Null
Event is not plotted
- Events are not displayed on the left-hand table or on the timeline in the following
conditions:
- When an event's Start Date is null.
- When both Start Date and End Date for the event are null.
- If an event's End Date is null, then the System Date is used for displaying the event.
Parent topic: View cohort timelines
Select the Timeline Mode
To view events in different ways, go to View same Events along the top and select one of the radio buttons:
On single line
This is the default mode of displaying data in a timeline.
In this mode, all instances of a repeating event are displayed on the same line and separate events are displayed on separate lines.
On multiple lines
In this mode, all of instances of events are displayed on different lines, even if the events are repeating.
Parent topic: View cohort timelines