4 Plans and visualizations
Studies Planned list
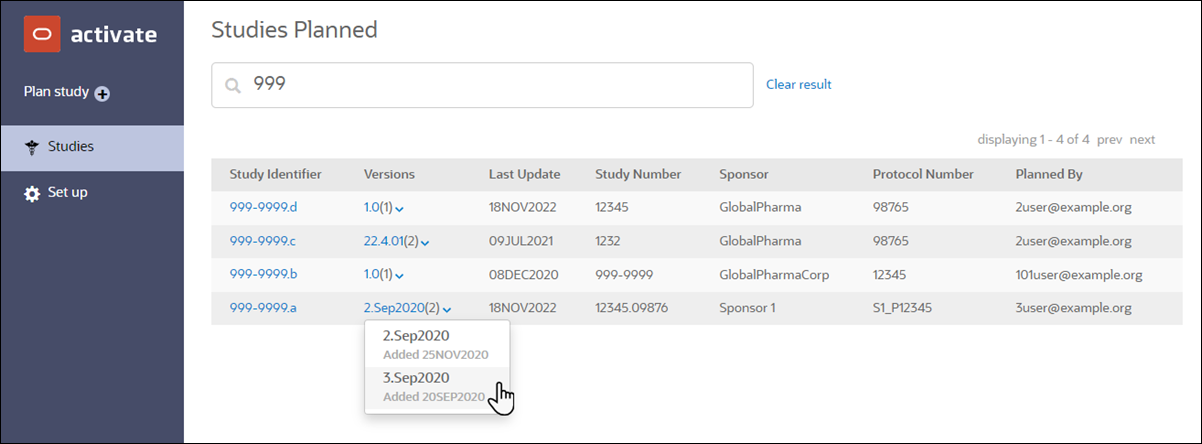
All users within an account who have been granted permission to access the Study Planning tool can view all study plans created for the account. The Studies Planned page provides a search field as well as pagination controls that simplify finding a plan. When you access the studies list, unique study identifiers display on a single row and a Versions column provides access to distinct plan versions tied to that study identifier. The Versions column shows the number of available versions in parentheses (e.g., (2)). Clicking on the version column displays the list of one or more plan versions, and you can access a plan's outcome by clicking on the version in the drop-down list.

If you click the Study Identifier instead, a "Planned" subpage displays all saved plan versions and provides access to Actions (![]() ). You can access a unique version’s plan outcome by clicking on a value in the Versions column. You can also navigate back to the Studies Planned page by clicking the "Planned" link at the upper left of the page.
). You can access a unique version’s plan outcome by clicking on a value in the Versions column. You can also navigate back to the Studies Planned page by clicking the "Planned" link at the upper left of the page.

Plan outcome in Tabular view
After a user selects a study from the "Studies Planned" list, the Study Planning tool displays plan outcome in Tabular (table) and Dashboard (bar chart and Gantt chart visualizations) format. By default, Tabular view displays, and users can switch the view to Dashboard using the tabs displayed above the plan outcome data. All countries specified in the plan's "Countries and Sites" setup display in the table and visualizations, and users can optionally adjust the filter control to view preferred countries.
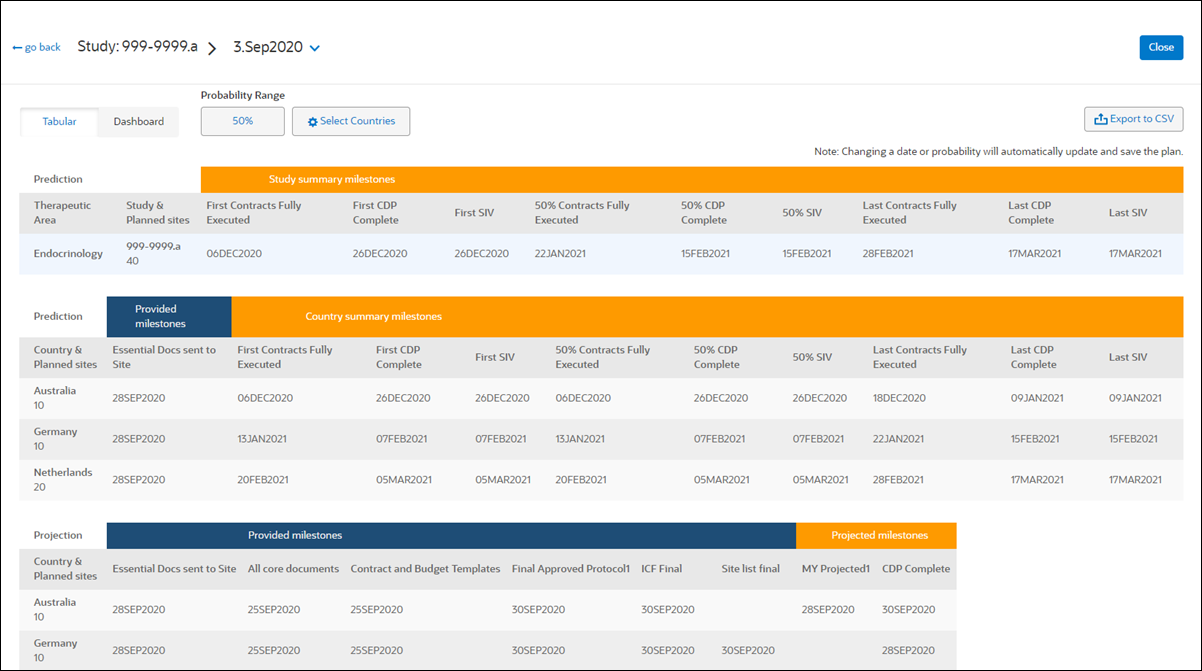
The summary milestone columns automatically order by date, from left (earliest) to right (latest). By design, dates displayed for summary milestones are not editable by study planners, as these dates are calculated automatically by the Study Planning tool.
Tabular view, shown below, shows study summary milestones that have been enabled for the account in the milestones set up area. When a study planner selects "Final Approved Protocol" or "Essential Docs Sent to Site" as the Prediction start date, the country summary milestone table's "Provided milestones" column shows only that milestone the planner selected. For example, when the planner selects Final Approved Protocol, Essential Docs Sent to Site will not display under Provided milestones. Instead, only the predictions of the selected (provided) milestone will be calculated and displayed to the user.
Tabular results also includes a projection table below the country summary milestone table. The table has two columns:
- Provided Milestones - start milestone used as the beginning of projection
- Projected Milestones - target milestone to be forecasted/projected. This is the provided milestone + user set interval (set specifically for the projected milestone, country and therapeutic area)
On the "country summary milestone" table, provided milestones are editable for each country. On the "projected milestone" table, both provided and projected milestones are editable for each country.

Using the Probability drop-down menu above the table, study planners can adjust the plan output to display a preferred percentage for prediction probability (25%, 50%, 75%, etc.). The default probability value is 50%, and when a planner selects a different value, the plan output page (tabular view, cumulative bar chart, and Gantt chart) automatically recalculate. When the user saves the plan, the newly-selected probability value will be saved as well.
Probability ranges
Study planners can create more realistic plans by specifying the probability range for plan results. On the study plan results page, above the tabular results, planners can select from the following Probability Range values:
- 25%
- 40%
- 50% (default minimum and maximum)
- 60%
- 75%
The Study Planning tool enforces realistic minimum/maximum selections and automatically modifies values and notifies users. For instance, if the user selects a minimum value of 75 and a maximum value of 25, Study Planning automatically updates the minimum value to 25, and the following message displays in the value selection modal, "Min value has been changed to match the lesser max value."
When a planner specifies probability range values, the following calculation logic applies to each plan country in succession:
- Study Planning tags the first site in a country with the lowest probability and subsequent sites with the next lowest probability, in succession, until it tags a site with each probability option from the specified range. Then tagging begins again from the lowest of the range. Sites that are historically the slowest receive the lowest probability.
- Example distributions for a selected range of 25%-50%:
- For a country with three sites, Study Planning tags one site as 25%, one as 40%, and one as 50%.
- For a country with five sites, Study Planning tags two sites as 25%, two sites as 40%, and one site as 50%.
- For a country with two sites, Study Planning tags one site as 25% and one site as 40%.
- Study Planning also follows a defined IRB/PI experience order when tagging sites for probability range distribution. The order is:
- Local/1 year
- Central/1 year
- Local/2-5 year
- Central/2-5 year
- Local/5 year
- Central/5 year
For example, when the specified range is 25%-75%, and the country includes three sites in Local/1year and three sites in Central/1 year, Study Planning will tag Local/1 year as 25%, 40%, and 50% and Central/1 year as 60%, 75%, and 25%.

Milestone predictions
The prediction engine uses study plan attributes and site characteristics to create accurate predictions. Country, Therapeutic Area, number of sites, IRB/EC type, and more – each of these data points affect milestone predictions. For instance, the prediction engine uses the plan's data points to calculate Contract Fully Executed and IP Release dates for each site, and the calculated dates are then used to predict the study summary and country milestone dates. Depending upon the number of sites planned in a country and the characteristics of those sites, some predicted summary milestones may specify the same date. This is expected behavior.
If a study planner manually edits a provided or projected milestone date (using ![]() in the date field), and that milestone is tied to a global milestone with prediction enabled, the predictions engine recalculates the date. When that recalculated date affects other downstream milestones, Study Planning dynamically adjusts the plan output view to reorder milestones from earliest to latest, as necessary. For example, if a study planner moves Essential Documents Sent to Site to an earlier or later date, predictions for the summary milestones for IP Release and Contract Fully Executed are automatically recalculated and ordered based on that new starting date. When a user manually updates a date, Study Planning automatically updates and saves the plan.
in the date field), and that milestone is tied to a global milestone with prediction enabled, the predictions engine recalculates the date. When that recalculated date affects other downstream milestones, Study Planning dynamically adjusts the plan output view to reorder milestones from earliest to latest, as necessary. For example, if a study planner moves Essential Documents Sent to Site to an earlier or later date, predictions for the summary milestones for IP Release and Contract Fully Executed are automatically recalculated and ordered based on that new starting date. When a user manually updates a date, Study Planning automatically updates and saves the plan.
When prediction is enabled for a projected global milestone, and the milestone that is mapped to the global milestone no longer obtains its projected date (cycle time) from the milestone's projection settings, it does not display on the plan outcome page. This is by design, as only summary milestones enabled for the global milestone display on the plan output page.
CSV export
Study planners can optionally export a plan to a .csv format file. The study plan Tabular view includes an “Export to CSV” button at the upper right, and Study Planning enables the button only for a saved plan. The first time the user views study plan page, before saving, the export button is inactive. The export button is also inactive when a user makes any change to a previously-saved plan.
The export includes significant plan detail, including:
- All completed fields from Planning “general specs” step, including:
- Study number
- Sponsor
- Sponsor protocol number
- Version reason
- Therapeutic Area
- Phase
- Indication
- Planning version
- Description
- Selected probability percentage
- Study summary milestones
- Country summary milestones
- Prediction results for the study, prediction results for each country, and projection results for each country
- Under the country area, the export includes individual site results, with sites organized by country name and:
- Country/Site description/Probability %
- Contracts Fully Executed (displays the customer-configured name for this global milestone)
- IP Release (displays the customer-configured name for this global milestone)
- Site description with Study experience and IRB/EC Type and probability percentage (e.g., “>5 Studies and Central IRB/EC 25%”)
When exported, the file name follows the format: study plan name_study number_plan version number.csv (e.g., samplestudyplanname_12345_2.csv).
Plan outcome in Dashboard view
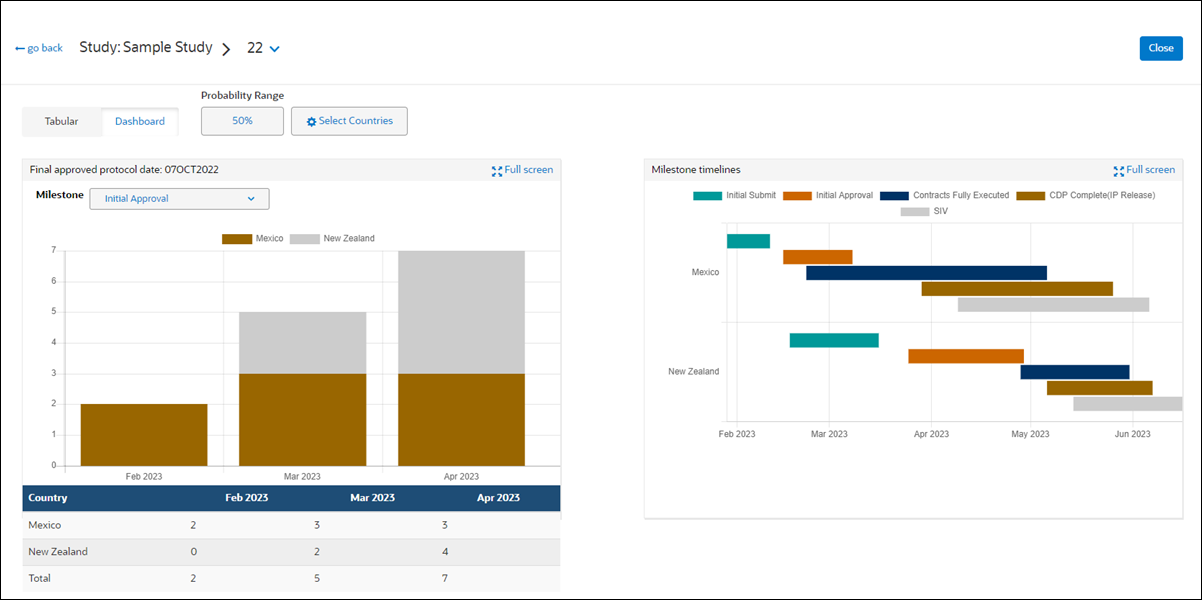
Study planners also have the ability to view plan visualizations in the Dashboard view. This view displays plan data in bar and Gantt charts. By default, all countries display in the charts, and users can optionally adjust the filter above the charts to specify preferred countries. The bar chart visualization's Milestone drop-down list also allows study planners to adjust the selected value without expanding the view to full-screen format.
The Dashboard view provides optional export to PDF format, if desired. These exports provide an easy way for study planners to share plan visualizations with others. When viewing a visualization in full-screen mode, an Export to PDF action button displays at the upper right of the screen. When clicked, the file exports with the following naming conventions based on the visualization type:
- Bar chart: Plan name_Version Reason_Planning Version_Bar
- Gantt chart: Plan name_Version Reason_Planning Version_GANTT

Note:
The Gantt chart displays a vertical line when the site characteristics of a country dictate that all sites are scheduled to start and complete a milestone on the same day.
- View plan outcome in tabular format
Tabular view shows study summary milestones enabled for the account in the milestones set up area. The summary milestone columns automatically order by date, from the left (earliest) to the right (latest). - View plan outcome in chart format
Use the Study Planning dashboard mode to evaluate plan outcome in bar chart and Gantt chart visualizations. - Export plan outcome table to CSV
Export tabular plan outcome to a CSV file to share the plan’s milestone data with others. - Export plan outcome chart to PDF
Optionally export bar chart and Gantt chart plan outcome to a PDF format file to share the visualizations with others. - Delete a study plan
You can delete a plan you created to remove it from the Studies Planned page.