6 Analyze Adoption Dashboard
Workbook synopsis
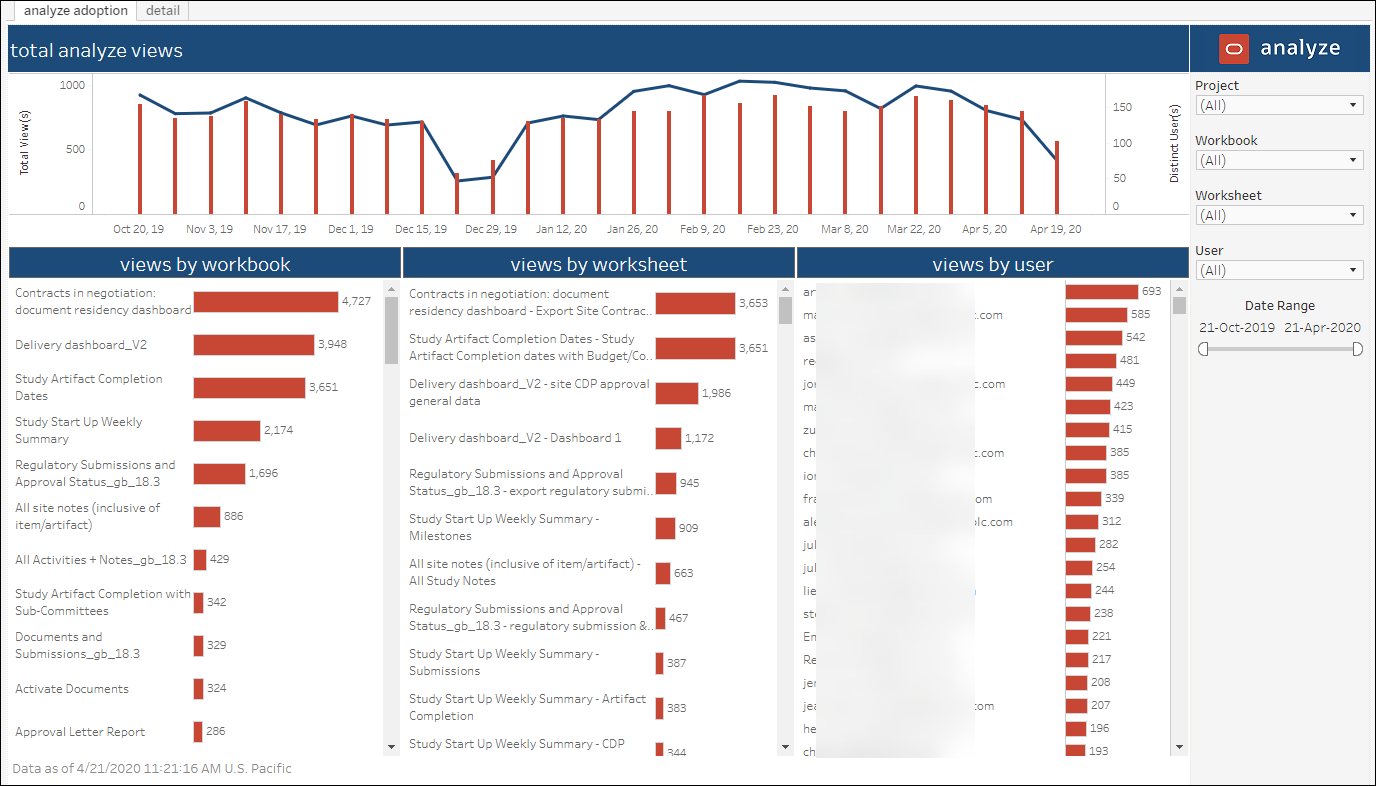
Using the Analyze Adoption Dashboard, Oracle Site Activate customers can easily monitor the adoption of Oracle Site Analyze within their organizations to understand which reports are used most frequently and which users log into the application most often.
Analyze Adoption
The Analyze Adoption sheet includes a trend graph in the upper section, with:
- Number of views per year, quarter, month, week, day
- Number of distinct user logins per year, quarter, month, week, day
you can also hover over a bar in the trend graph to view date and distinct user counts.
The report's lower section includes three horizontal bar charts, all of which act as filters when clicked:
- Number of views by workbook
- Number of views by worksheet
- Number of views by user

Detail
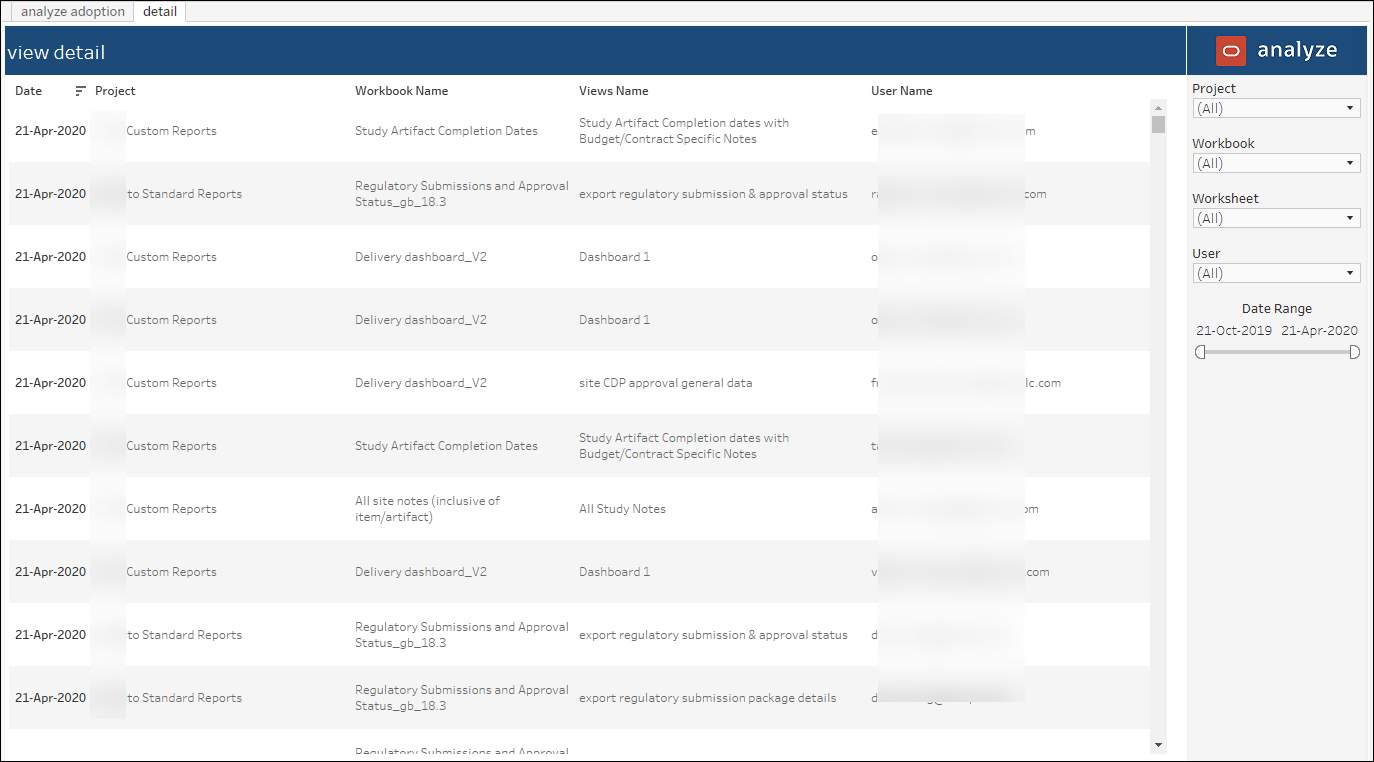
The Analyze Adoption Dashboard also includes a "Detail" sheet, which you can access directly or drill into from the Analyze Adoption sheet. The Detail sheet provides the following data in tabular format:
- Date viewed
- Project
- Workbook name
- View name
- User name
