9 Cycle Times
Workbook synopsis
This Cycle Times Dashboard, which is intended for Oracle Site Activate customers, includes key cycle metrics with configurable cycle start and end points. Users can save their own custom views with the cycles that provide the most value to them.
Dashboards and sheets
About
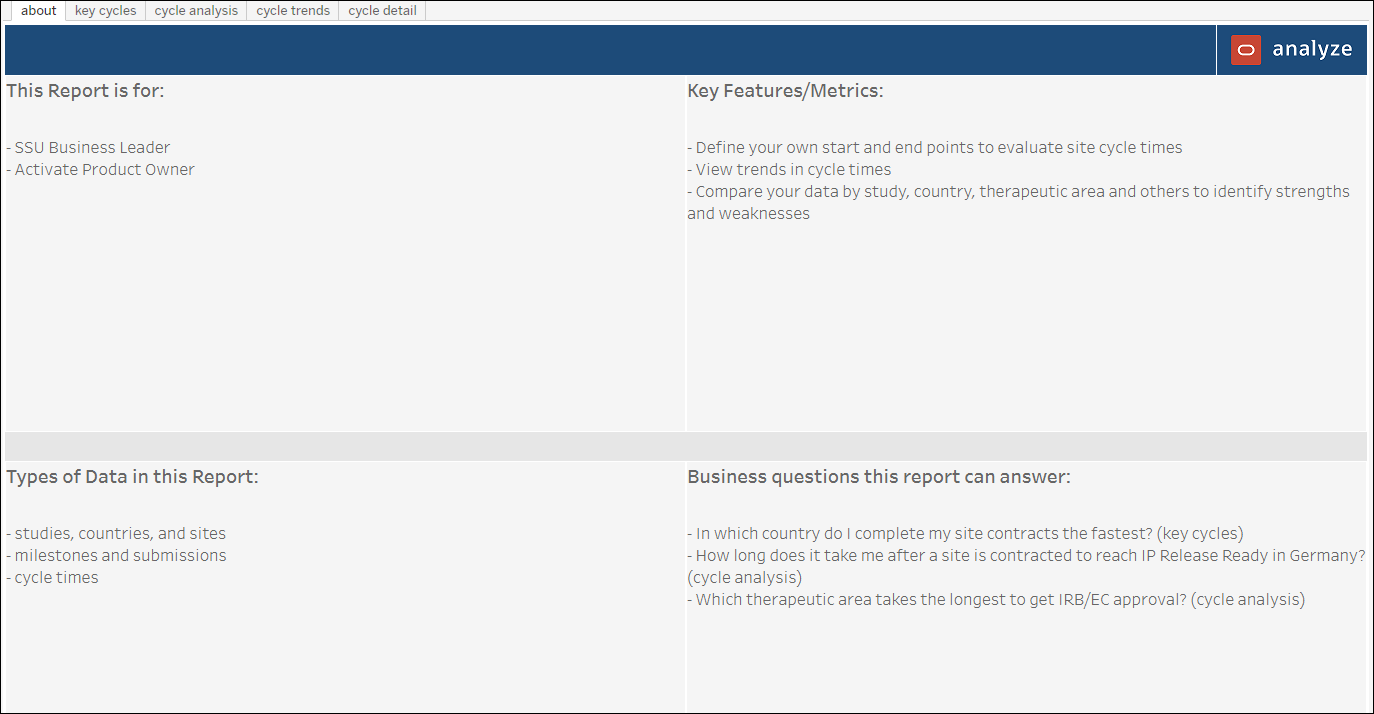
- Study startup roles that would use the report
- Key report features and metrics
- Types of data the report contains
- Examples of how to use the report to answer a business question
Key Cycles
The Key Cycles report provides an at-a-glance view of four key Oracle Site Activate cycle times in a single dashboard view. For both start and end, report users will specify the level, point, category and type for each of the four key cycles. The key cycles display in a horizontal row with the number of cycles, median cycle time, and a box and whisker plot controlled by a "Compare your data by" parameter. Report users can also optionally adjust the view to day, week, or month.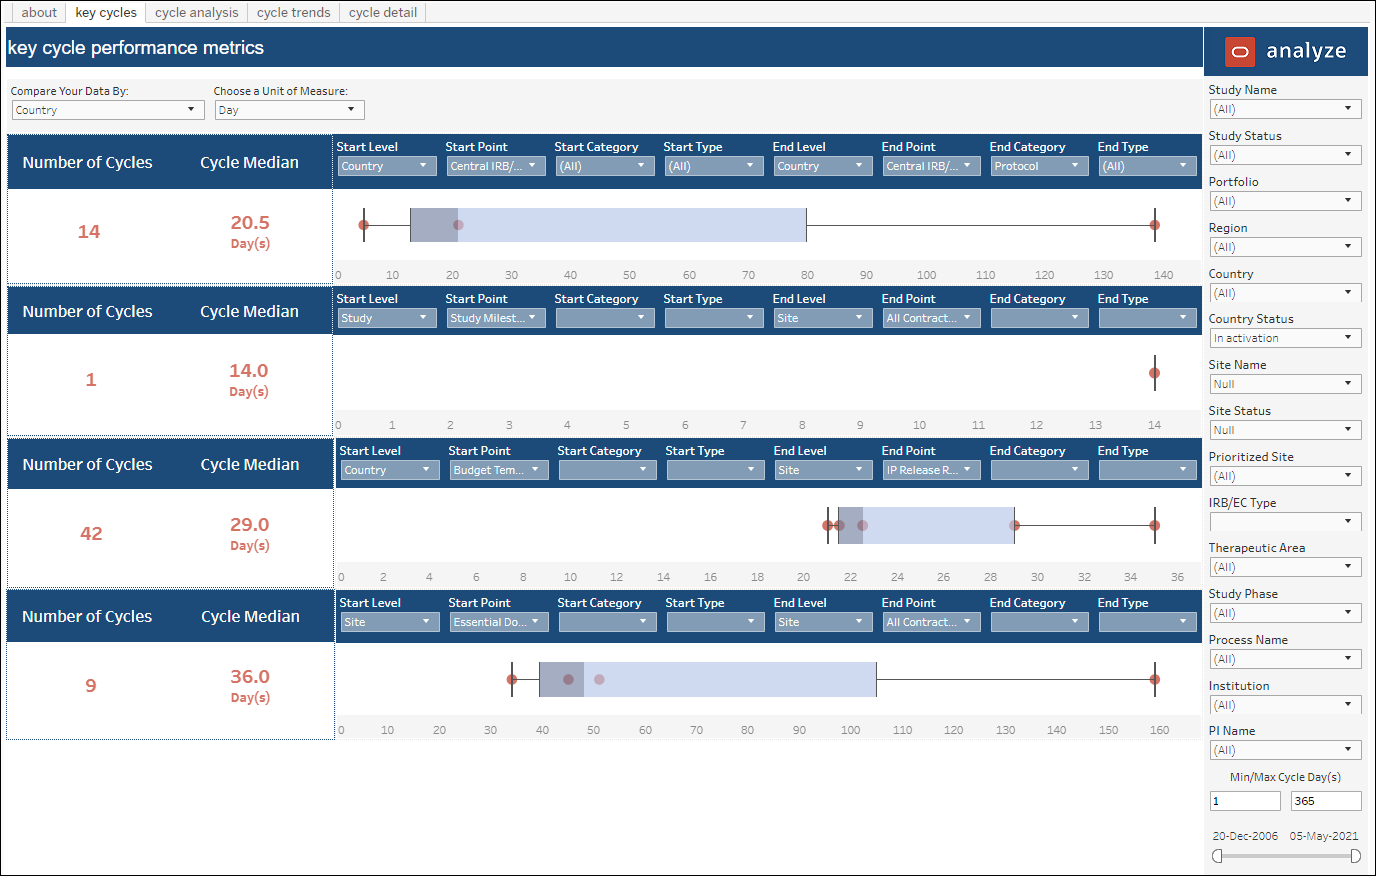
Cycle Analysis
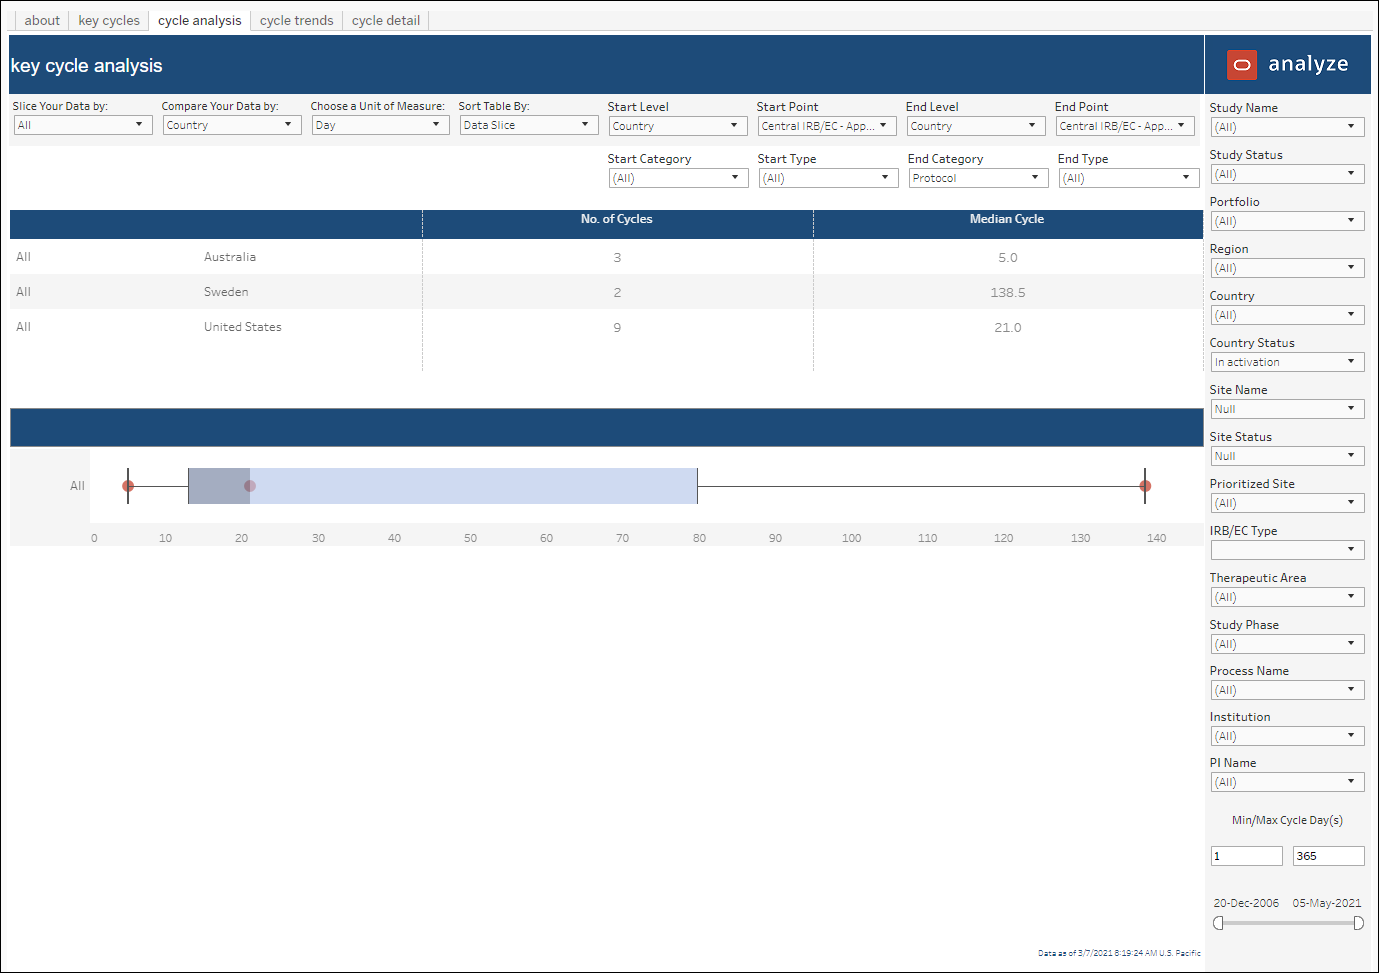
- Select a cycle (start and end level, point, category, and/or type)
- Slice your data by: All, Portfolio, Region, Country, Study, Therapeutic Area, Study Phase, PI Name
- Compare your data by: All, Portfolio, Region, Country, Study, Therapeutic Area, Study Phase, PI Name
- Choose unit of measure: Day, Week, Month
- Sort table by: Data Slice, Number of Cycles, Median Cycle
The upper section of the analysis sheet presents data in a tabular format with drill to detail functionality, while the lower section of the report presents data in a box and whisker plot format (dimensions based on "Slice data by" parameter and dots based on "Compare data by" parameter).
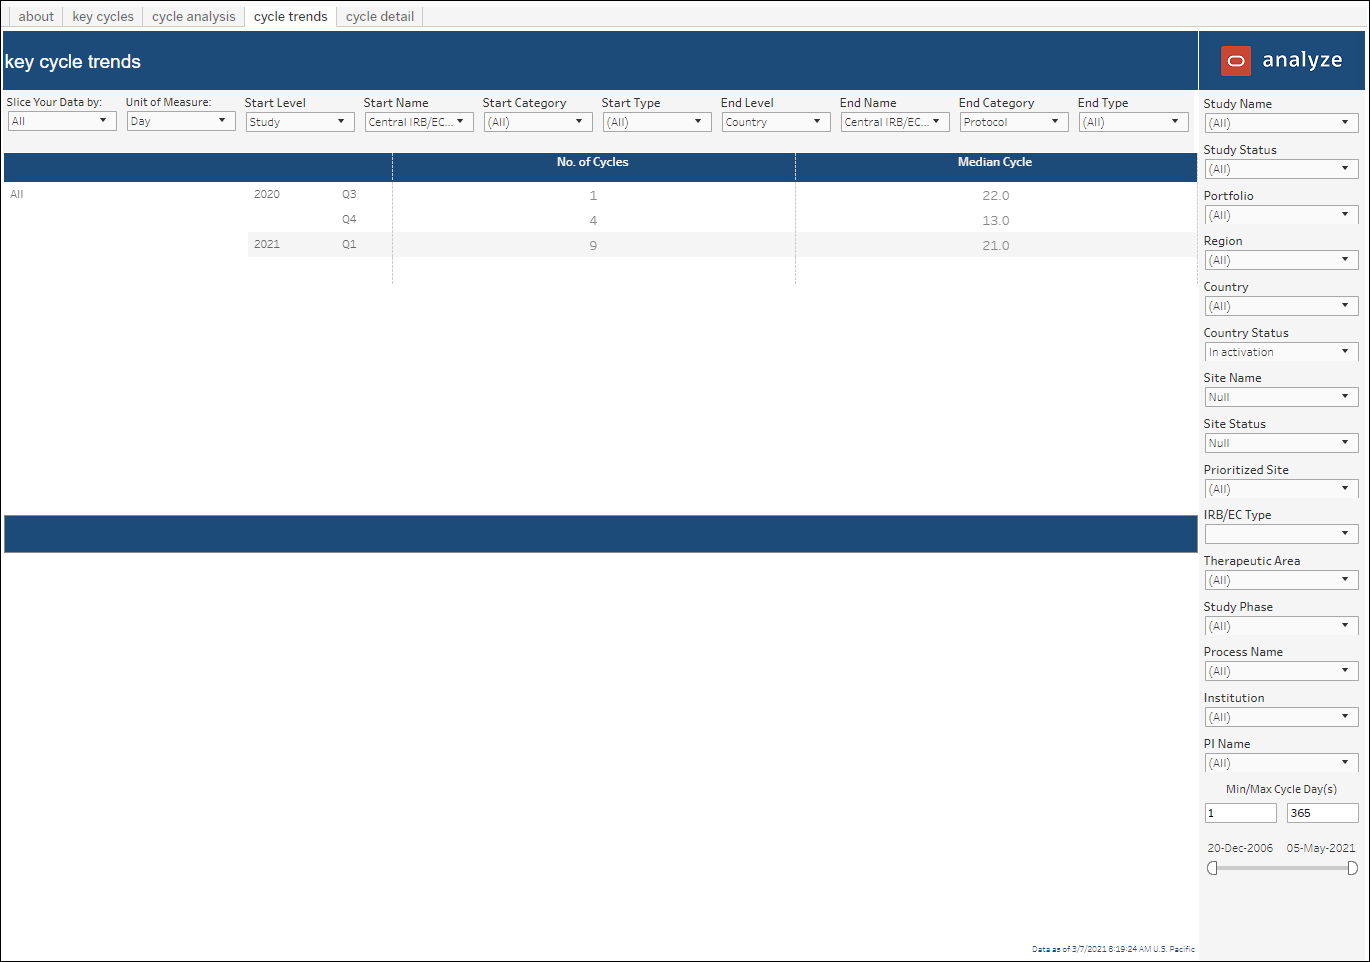
Cycle Trends
- Slice your data by: All, Portfolio, Region, Country, Study, Therapeutic Area, Study Phase, PI Name
- Choose unit of measure: Day, Week, Month
- Sort table by: Data Slice, Number of Cycles, Median Cycle
The upper section of the Cycle Trends sheet presents data in a tabular format. The lower section's trend graph is a line chart that renders the median cycle time based on selected parameters.
Cycle Detail
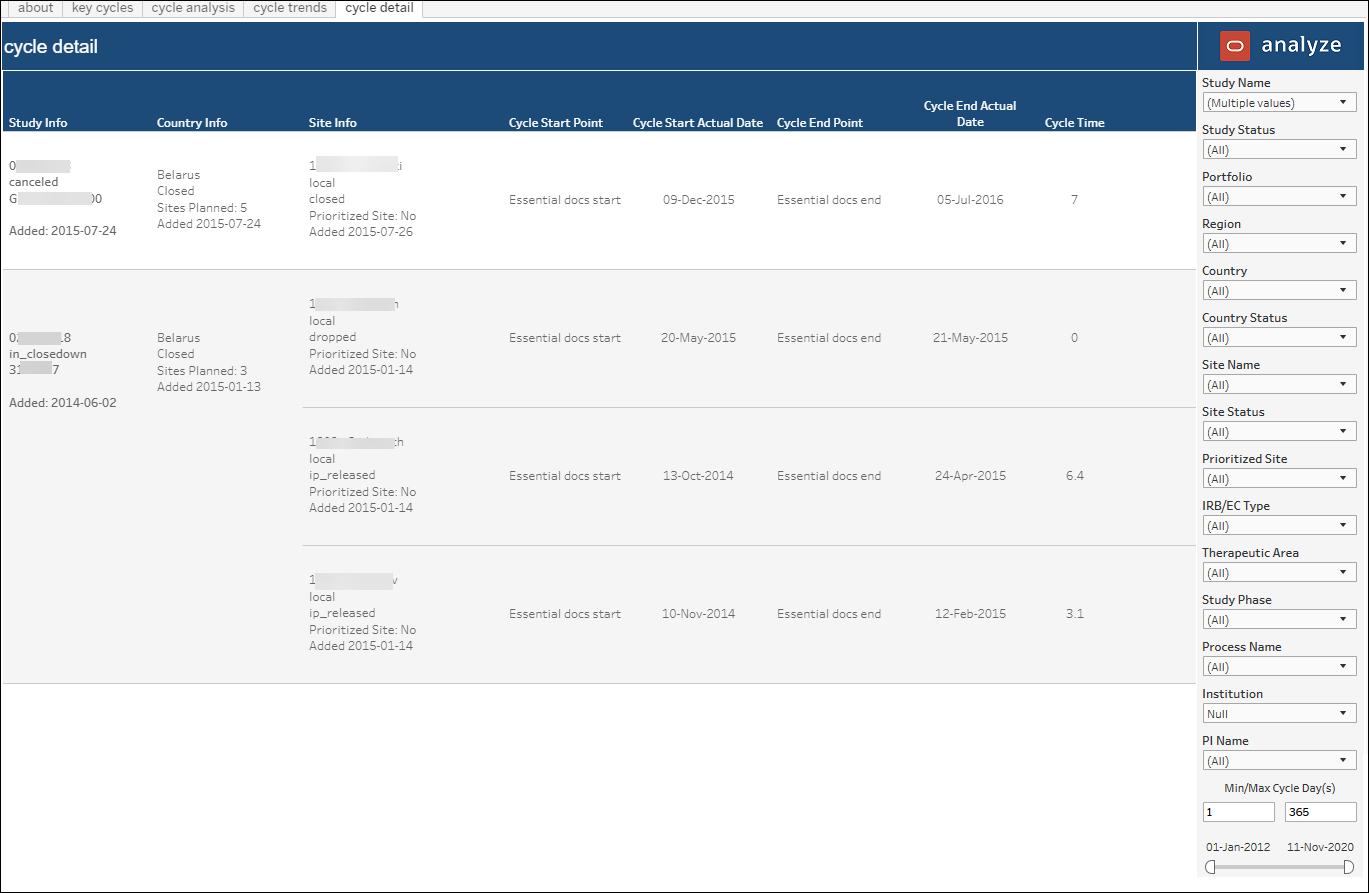
- Study
- Country
- Site
- Cycle start point
- Cycle start actual date
- Cycle end point
- Cycle end actual date
- Cycle time
Report users can drill into the Cycle Detail sheet from the Key Cycles and Cycle Analysis sheets.
