15 Site IP Release Package
Workbook synopsis
Intended for Oracle Site Activate users, the Site IP Release Package Dashboard workbook allows you to see granular package and document statuses and understand the state of all IP release packages for a study.
Dashboards and sheets
About
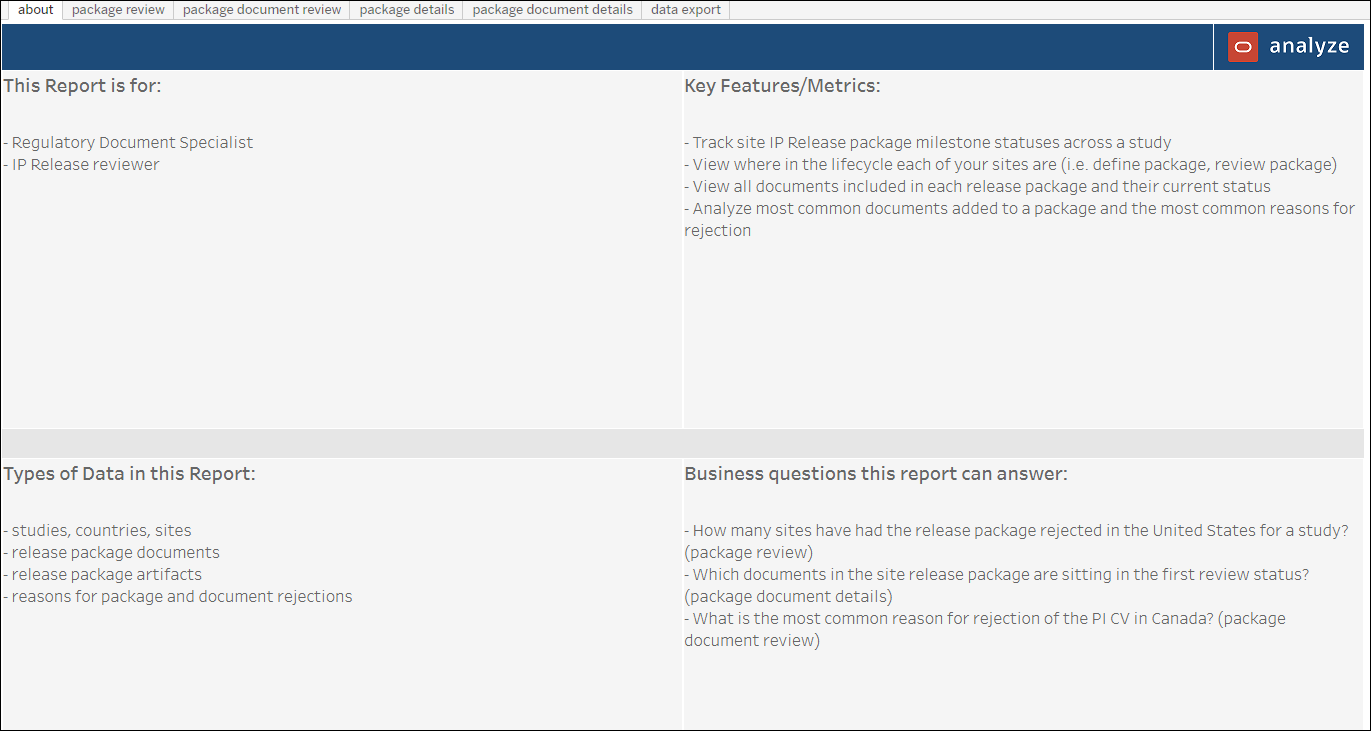
- Study startup roles that would use the report
- Key report features and metrics
- Types of data the report contains
- Examples of how to use the report to answer a business question
Release Package Review
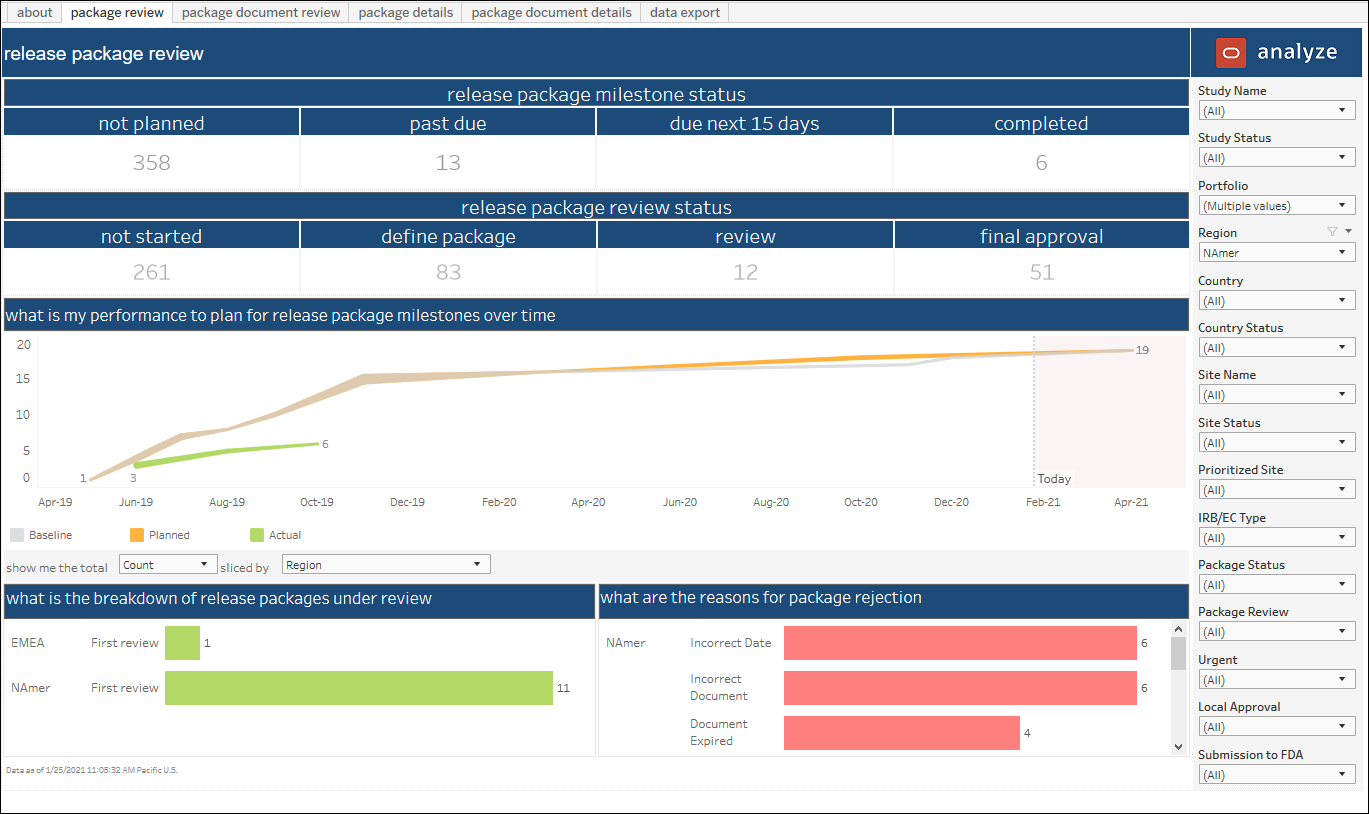
This dashboard is a high-level summary of overall status of all IP release packages, with a breakdown of package review status and rejection reasons.
The top of the dashboard displays the following top-level KPIs (based on activity type as specified in the Oracle Site Activate lifecycle):
- release package milestone status (derived from the milestone)
- not planned
- past due
- due next 15 days
- completed
- release package review status (derived from the lifecycle)
- not started
- defined
- reviewed
- approved
A trend graph, in the middle section of the dashboard, shows a comparison of baseline, planned and actual IP Release ready milestone dates. The bottom of the dashboard includes two bar charts – with the left bar chart showing package status and the right bar chart showing reasons for package rejection.
Release Package Document Review
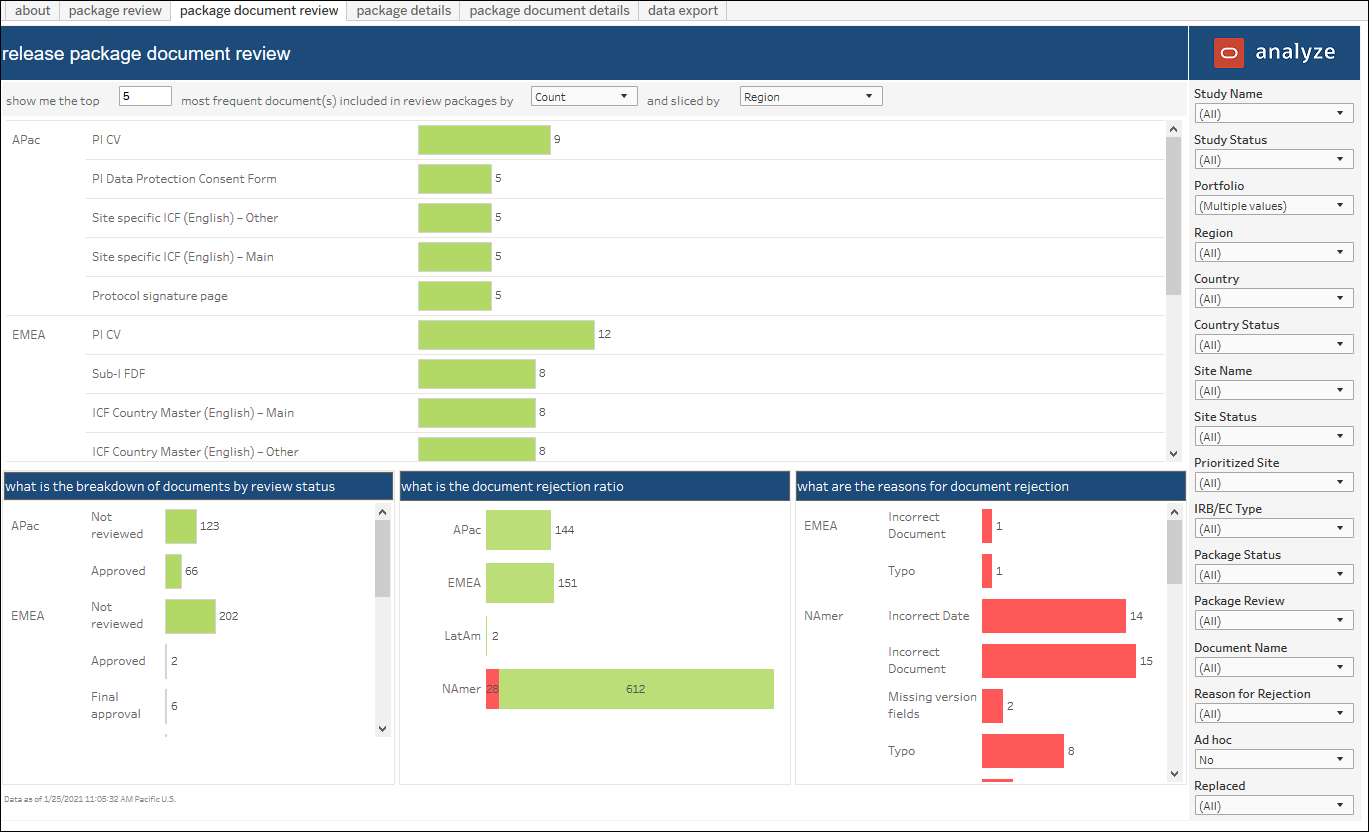
This dashboard allows you to understand most the most common documents in a package as well as the most commonly rejected documents and their reasons for rejection.
At the top of the dashboard, a horizontal bar chart displays the count or percentage of document name included in a package, sorted in descending order. Each of the bars in this upper chart acts as a filter for data displayed in the lower section of the dashboard.
The lower section is divided into three horizontal bar charts as follows:
- The lower left chart shows the breakdown of document review status
- The lower middle chart shows the rejection ratio per parameter selected (portfolio, study, region, country, all)
- The lower right chart shows the count of document rejection reasons
Release Package Details
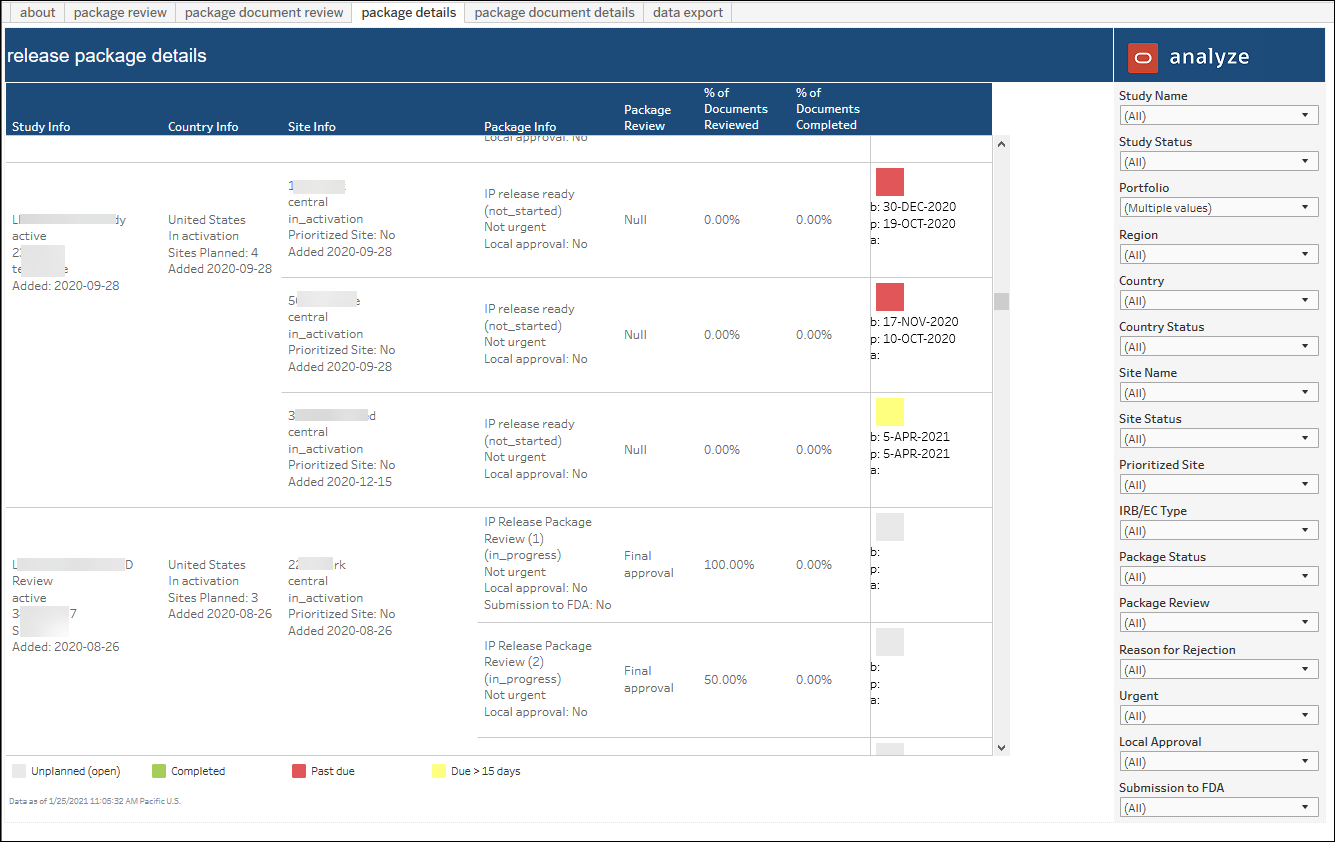
This worksheet shows you the details of the review package, including package information, and document review and completion percentage.
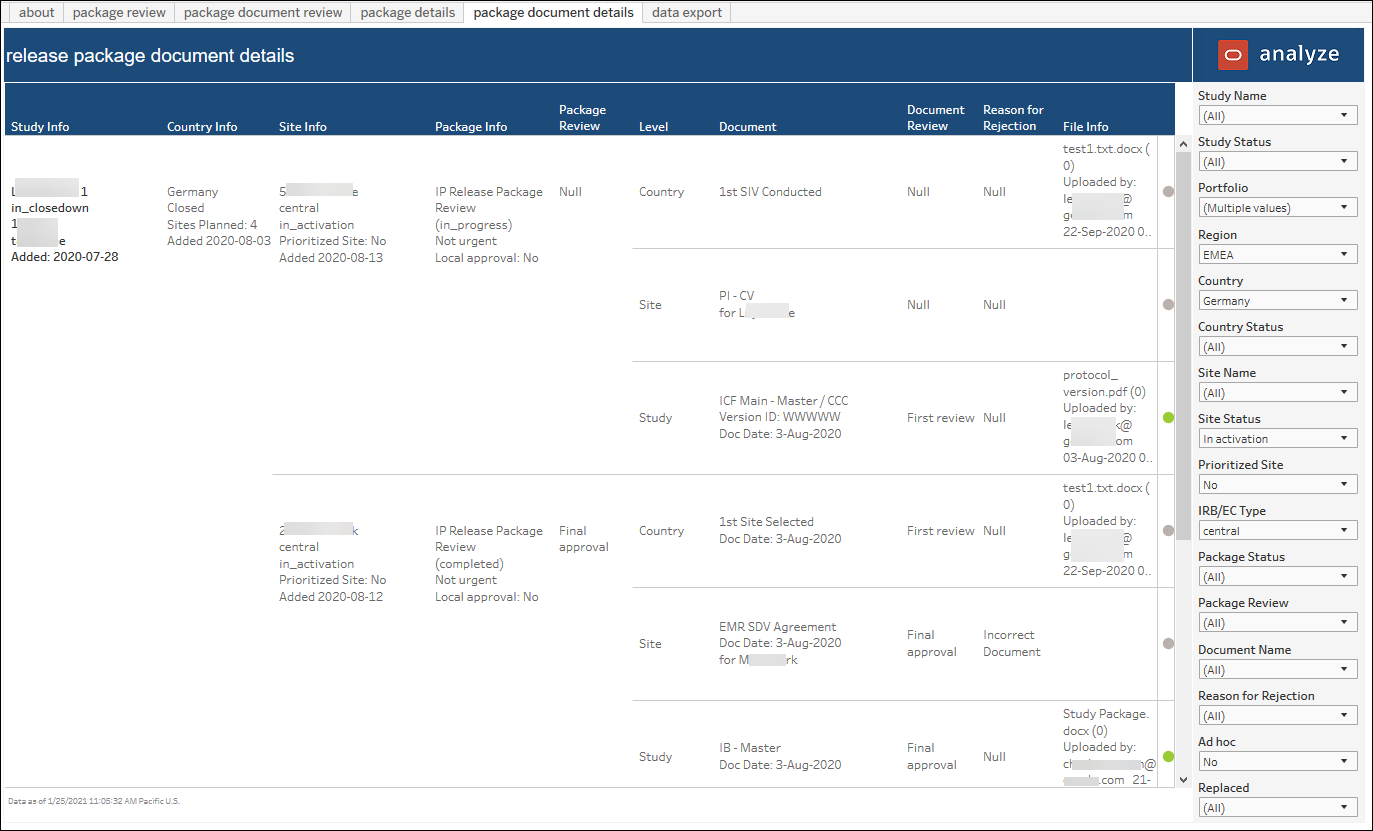
Release Package Document Details
This worksheet shows you the details of the documents included in the review package, including package status, document status, and rejection reasons.
Data Export
This worksheet allows you to export the package details to Microsoft Excel or CSV.
