8 Select Account Reconciliation Dashboard
Workbook synopsis
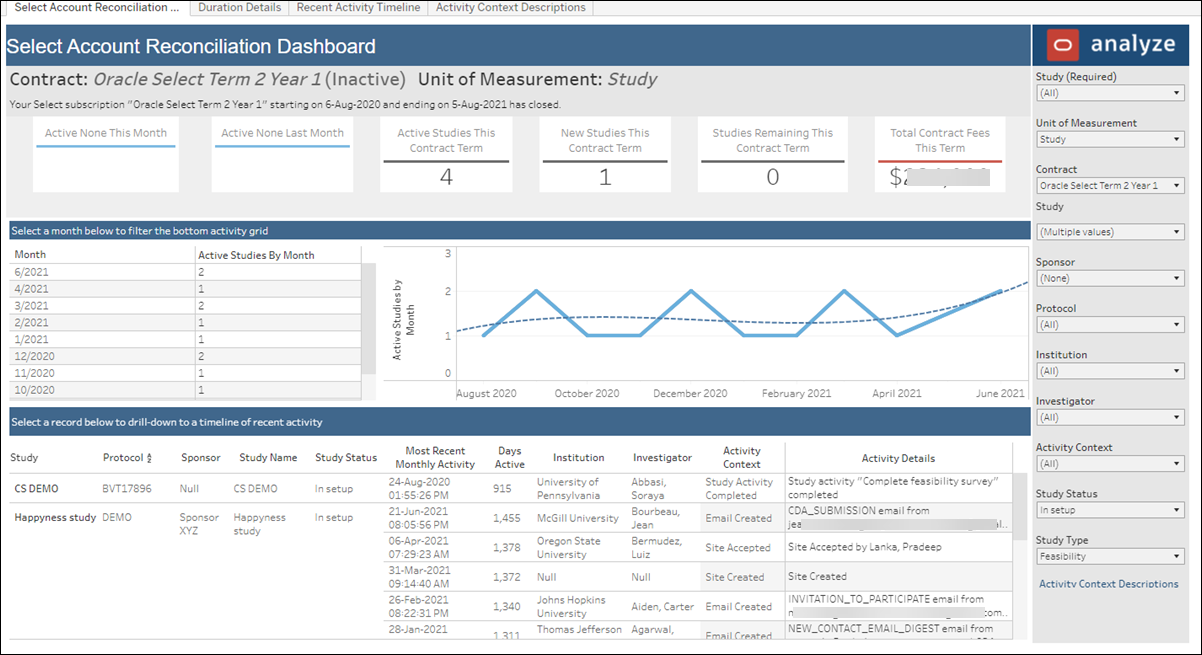
The Select Account Reconciliation Dashboard report provides metrics that help managers understand monthly study volumes and evaluate the total cost of Oracle Site Select for the business.
Dashboards and sheets
Select Account Reconciliation Dashboard
- Active Studies This Month
- Active Studies Last Month
- Active Studies This Contract Cycle
- Studies Remaining This Contract Cycle
- Total Contract Fees This Year
The center of the dashboard includes a tabular data chart with monthly active study totals, as well as a trend line chart showing active studies per month. Report users can click any month in the chart to filter the table at the bottom of the dashboard.
- Protocol
- Sponsor
- Study Name
- Study Status
- Most Recent Monthly Activity
- Days Active
- Institution
- Investigator
- Activity with Context
Report users can quickly drill to a study's activity timeline (sample below) by clicking any study name in the bottom table.
Using the filter panel to dashboard’s right, report users can filter the dashboard by Contract, Sponsor, Protocol, and more. Note that the “Unit of Measurement” filter includes a “Study Parsed” option. Study Parsed is the study’s protocol value, which Oracle Site Analyze parses from the Study Name field. This filter option allows report users to group the dashboard data by either Study Name or Study Parsed unit of measurement. The Unit of Measurement selection affects dashboard labels as well. For instance, when a report user selects Study Parsed for Unit of Measurement, the dashboard automatically updates "Active Studies this Month" to "Active Protocols this Month." This type of context change also happens automatically in the right-side filter panel, where the “Study” filter automatically updates to “Protocol (Parsed).”

Duration Details
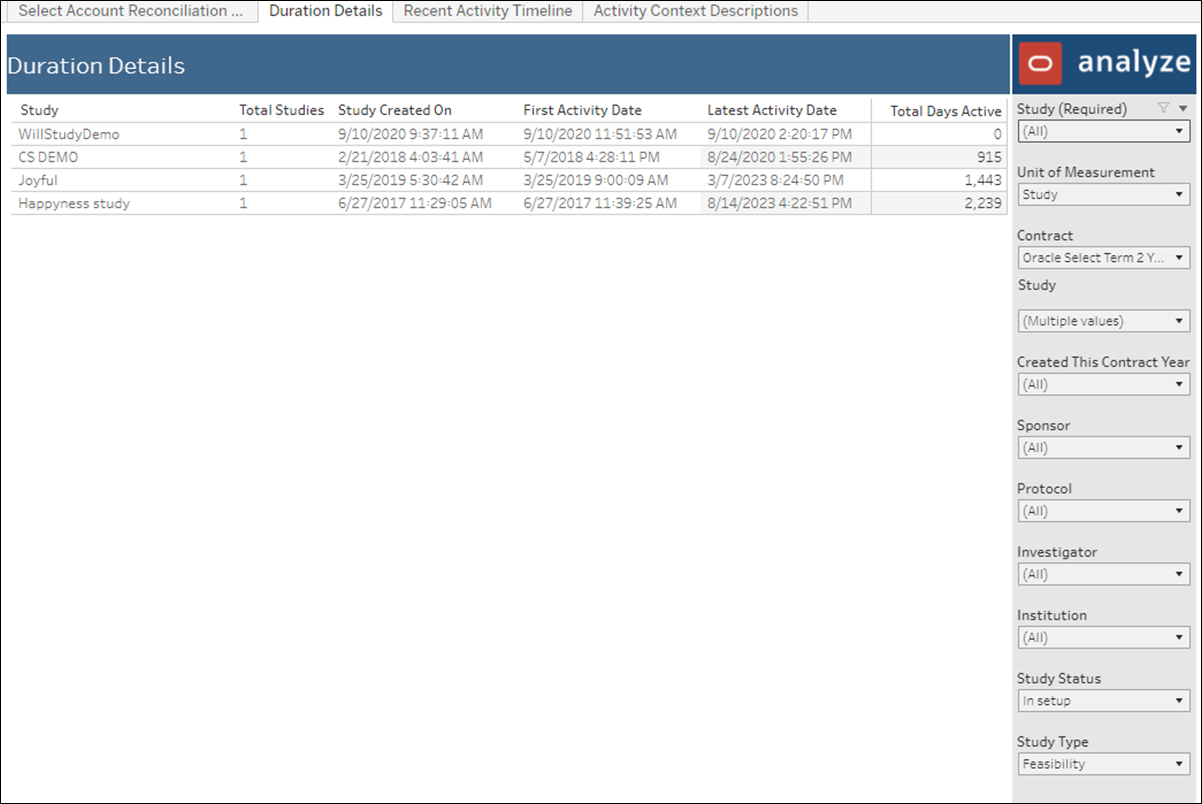
The report's Duration Details worksheet provides the following detail:
- Study Created On timestamp
- First Activity Date timestamp
- Latest Activity Date timestamp
- Total Days Active
Familiar filters (e.g., Sponsor, Investigator, Institution, etc.) are available in the right side panel. Note that the filter panel also includes the updated “Unit of Measurement” filter (described above) with Study and Study Parsed options that allow the report user to see how long the study or protocol has been active.

Recent Activity Timeline
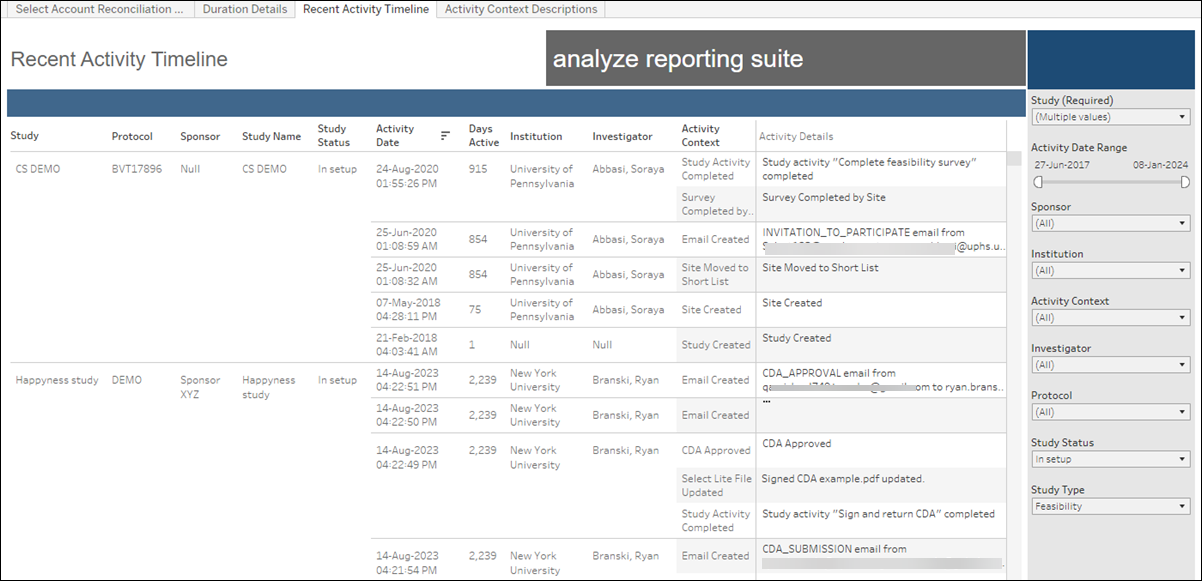
- Protocol
- Sponsor
- Study Name
- Activity Date
- Days Active
- Institution
- Investigator
- Activity with Context
The filter panel to the right allows users to subset the view by Sponsor, Study Name, Institution, and more.

Activity Context Descriptions
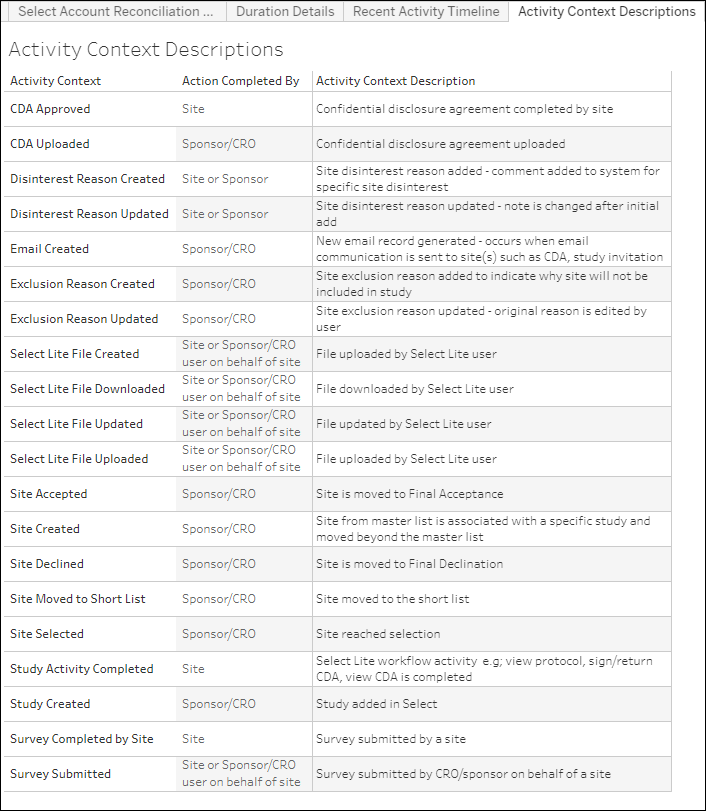
The Account Reconciliation report also includes a Activity Context Descriptions worksheet that defines standards for activities. Report users can refer to one source to see:
- Activity Context – The activity name (e.g. Study Created, CDA Approved, or Survey Submitted)
- Action Completed By – The actor (e.g. Site, Sponsor/CRO, Site or Sponsor/CRO user on behalf of site)
- Activity Context Description – Standardized activity description
Report users can access the definitions worksheet from a new link in the Select Account Reconciliation Dashboard’s filter panel or by navigating to the Activity Context Descriptions tab.
