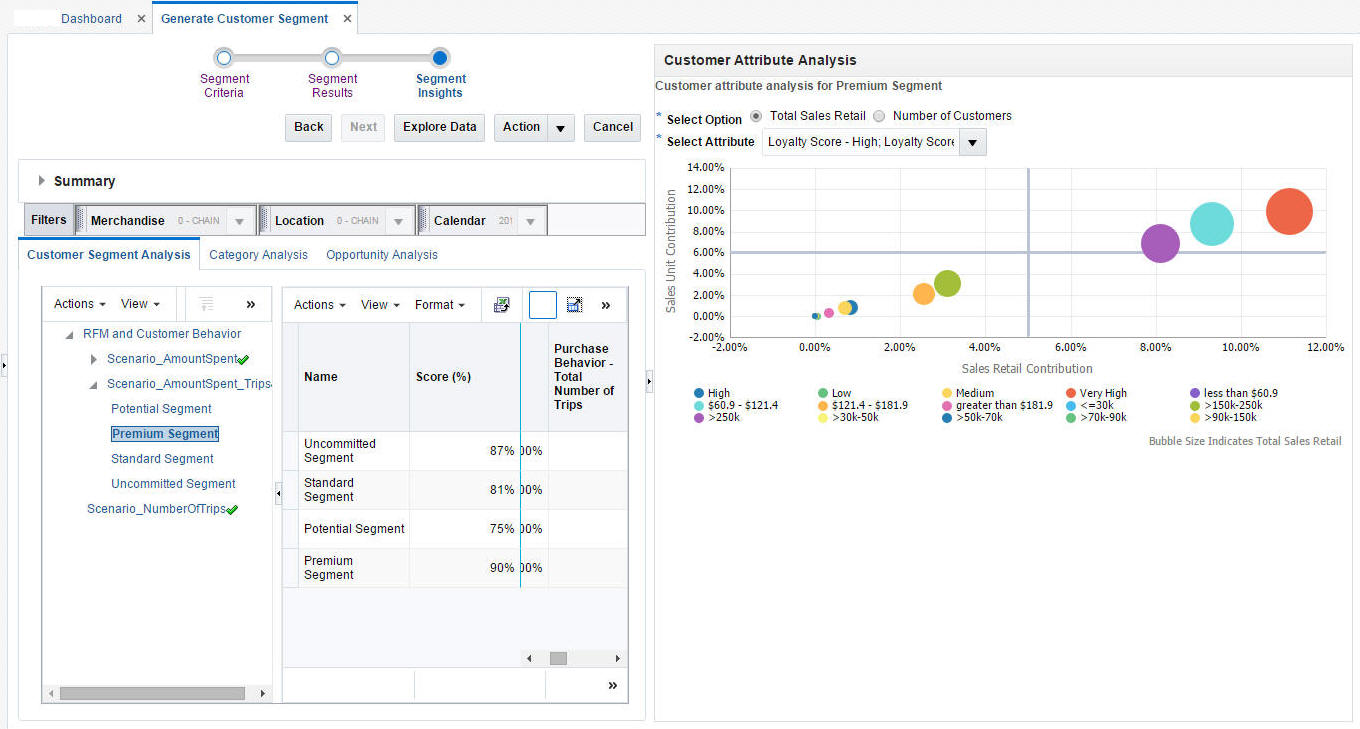
Customer Attribute Analysis BI
Customer attributes are analyzed and compared to identify the most prominent selling attributes within a segment. This indicates how the customer attributes are correlated and what each attribute in the specified segment contributes to sales. You can make inferences about which attributes in the segment contribute to significant sales and the potential attributes that should be considered for assortment planning in order to improve sales even more. This chart also provides you with the option to see the number of customers in each segment instead of total sales retail, thus providing insights about how many customers with certain attributes and attribute values are present in certain segments. Figure 5-38 shows how customers with high income and high loyalty score contribute to most of the sales in the segment.
The following properties are displayed by the graph. Note that the customer attributes are only displayed when they are configured as part of the Cluster by process.
Table 5-29 Properties
| Axis | Description |
|---|---|
|
x-axis |
Sales Retail $ contribution, calculated using the sales revenue share of each attribute in the segment with respect to the total segment sales revenue. |
|
y-axis |
Sales Unit $ contribution, calculated using the sales unit share of each attribute in the segment with respect to the total segment sales units |
|
z-axis |
Total Sales Retail $ or number of customers of each attribute in the selected segment, indicating, via the bubble, the magnitude of the sales contribution. |
