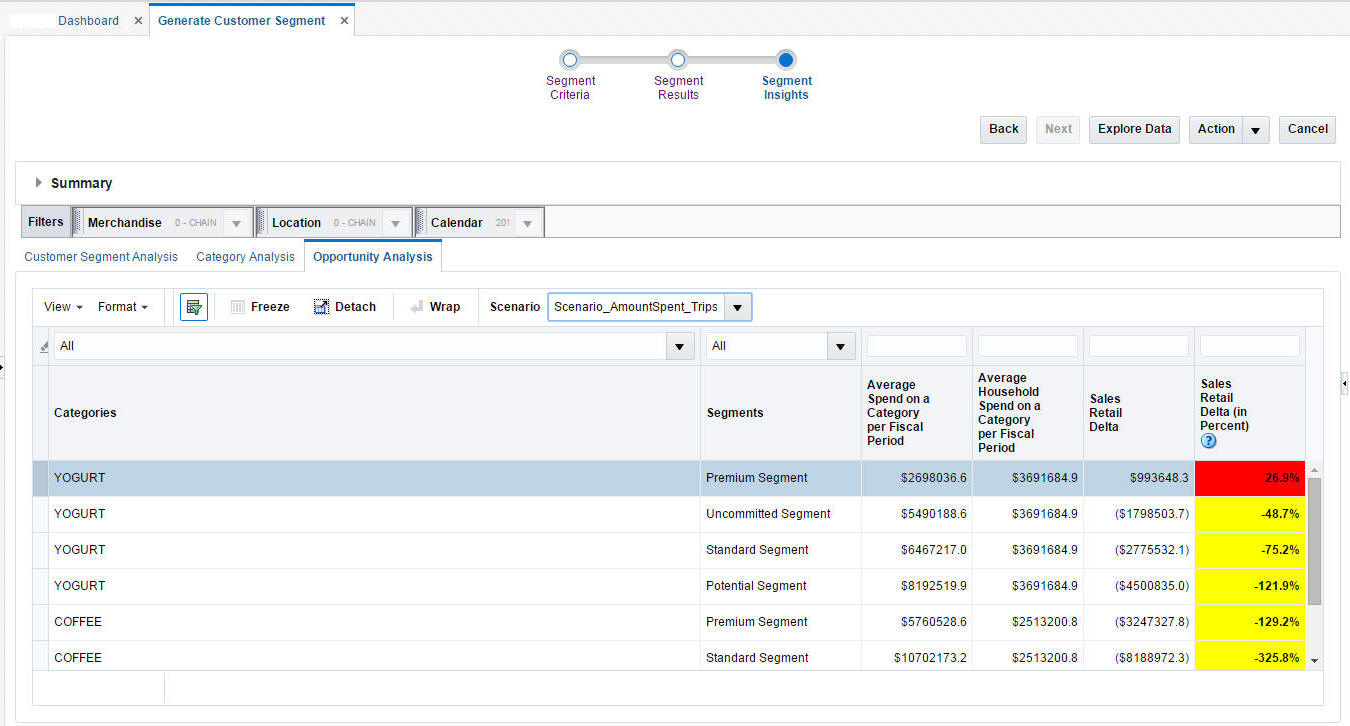
Opportunity Analysis Tab
The Opportunity Analysis tab provides a comparison of the retailer to market data analysis for the category and provides an analysis about where there is an opportunity for the retailer to grow for each segment.
You can compare where the retailer is performing better by comparing the average sales retail spend per <configurable time period>.
Table 5-27 Opportunity Analysis
| Field Name | Description |
|---|---|
|
Segment |
The segments for the selected scenario. |
|
Category |
The top identified categories in the preprocessing. |
|
Average spend on a category per <configurable time period> |
The average amount spent for a segment. |
|
Average household spend on a category per <configurable time period> |
The average household amount spent for a segment. |
|
Sales retail delta |
The difference in sales retail between retailer and market data. |
|
Sales retail delta as a percent |
The percentage difference in sales retail between retailer and market data. |
The color indicators listed in the following table help you see if the difference in sales retail is above or below a certain threshold or within an acceptable range. This grid is sorted with the sales retail difference as negative or highlighted as red, so that you can review the values below threshold first.
| Color | Value |
|---|---|
|
Red |
X percent below |
|
Green |
Y percent above |
|
Yellow |
In between X below and Y above |
This grid provides a filter for customer segment and category, so that you can review the category for each segment or vice versa.
