Offer Scorecard
The Offer Scorecard displays information about the Offer response in a Promotion. You have the ability to periodically review the response data on Offers that are part of promotions. The Offer Scorecard also displays additional tiles for Loyalty related offers.
Figure 6-65 Offer Scorecard
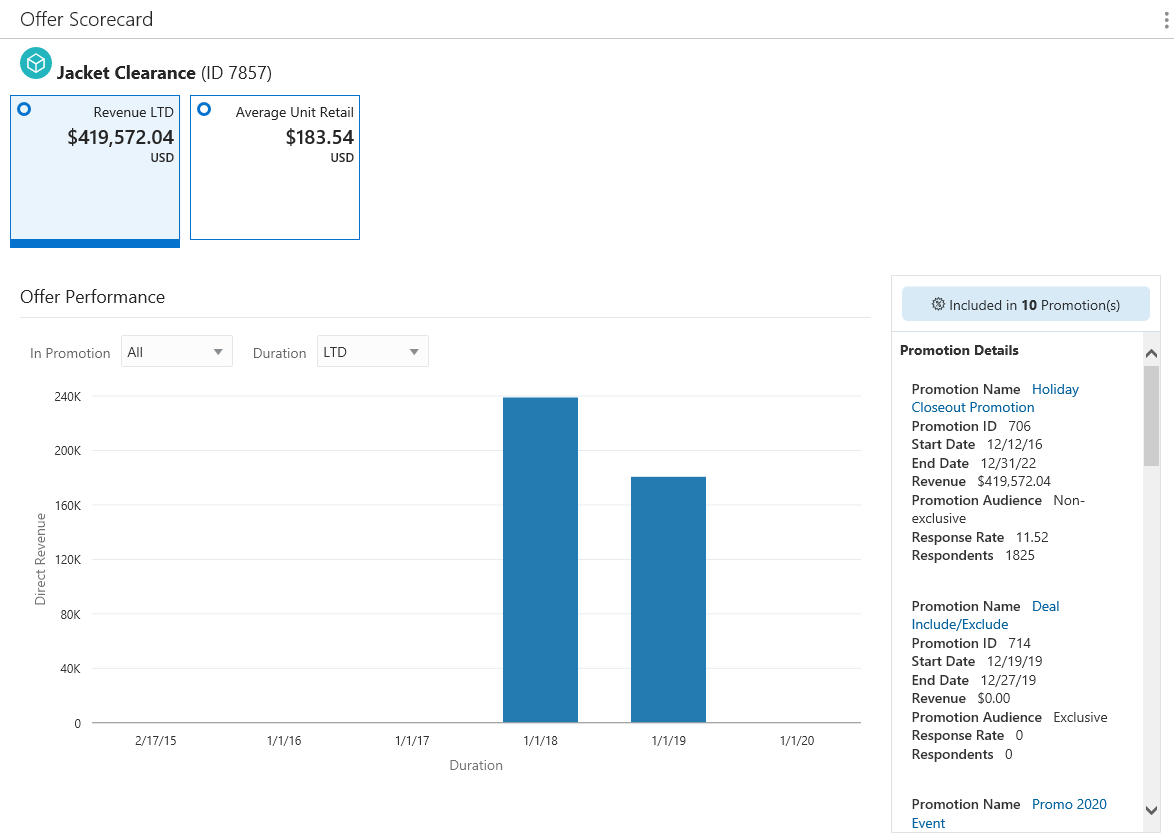
Figure 6-66 Offer Scorecard - Loyalty
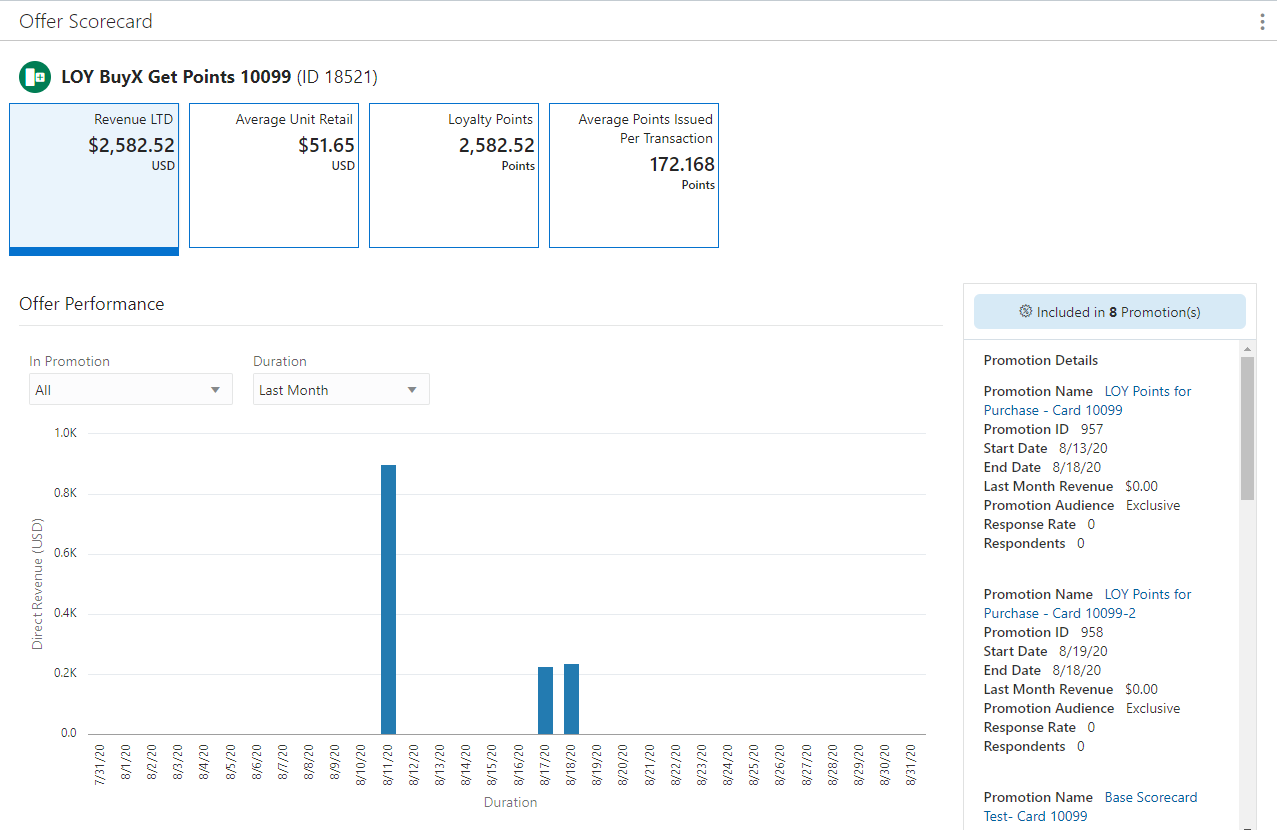
Offer Scorecard Feature Bar
The Offer Scorecard Feature Bar contains the following information:
-
Title of the window.
-
Action Menu with the ability to View, Edit, or Duplicate the Offer.
Figure 6-67 Action Menu Options

Metric Tiles
Each offer presents a different set of Metric Tiles, click each one to see more information.
Revenue LTD
The Revenue LTD Metric Tile is: Total Direct Revenue generated Lifetime to Date (LTD) from the Offer.
Offer Performance
-
In Promotion Filter – List of all the Promotions that the offer is associated with.
-
Duration– Durations include:
-
Last Week - Offer performance for Last Week (7 days (Current date (-1)) display.
-
Last Month (Default) – Offer performance for Last Month (Current date (-1)) display.
-
Last 6 Months – Offer performance for Last 6 Months converted into weeks (Current date (-1)) display.
-
Last Year – Offer performance for Last 12 months (Current date (-1)) display.
-
Lifetime to Date – Offer performance for the last 5 years (Current date (-1)) display.
-
Graph
-
The bar graph dynamically updates the Offer performance based on the value selected for the In Promotion and Duration.
-
By default the Offer performance graph displays for All the Promotions which the Offer is part of for the Last Month.
-
The graph represents a plot between the Direct Revenue on Y-axis and Duration on X-axis for each individual Promotion.
Promotion Details Side Panel
-
Promotion Name – Name of the Promotion.
-
Click the Promotion Name link from the Promotion Details panel on the Offer Scorecard window to display the View Promotion window for the selected promotion on the same tab. Click Done to return to the Offer Scorecard.
See Viewing a Promotion to learn more about the information on that window.
-
-
Promotion ID – ID of the Promotion.
-
Start Date – The date the Promotion begins.
-
End Date – The date the Promotion ends.
-
Revenue – Offer's Revenue display depending on the value selected in the duration.
-
Promotion Target – Indicates the type of targeting used by the Promotion (Nonexclusive or Exclusive).
-
Response Rate – Calculated by dividing the total number of Respondents by the Total number targeted. Set to 100.00 for Non-Targeted customers.
-
Respondents – Number of Customers in the Target who have responded to the Offer in the Promotion. This is the same as the Total for Non-Targeted customers.
Average Unit Retail Tile
The Average Unit Retail calculated for a given item over a select period of time. To calculate AUR, you simply take the total revenue (or net sales) divided by the number of units sold.
Figure 6-68 Average Unit Retail Tile
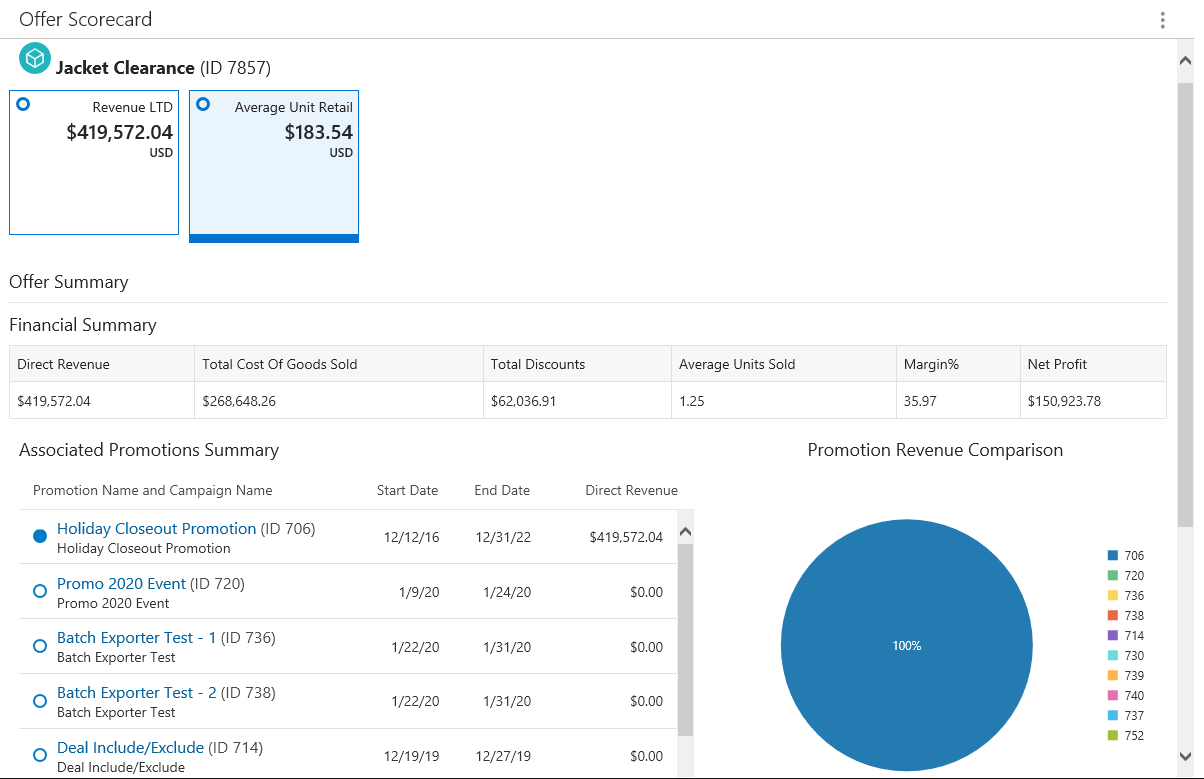
Financial Summary
-
Direct Revenue – Sum Total of the Revenue generated using the offer.
-
Total Cost of Goods Sold – The sum total of the cost of all the items sold on which the offer was applied.
-
Total Discounts – Sum Total of the Discounts.
-
Average Units Sold – Total Number of Items Sold /Total Number of unique Transactions.
-
Margin % – Net Profit /Direct Revenue
-
Net Profit – Direct Revenue minus Total Cost Of Goods Sold
Associated Promotions Summary
Data Section
-
A full circle represents an Active Promotion or an Empty circle represents an Inactive Promotion.
-
Promotion Name and Campaign Name – Name of the Promotion and Campaign.
-
When a user selects the promotion name from the list of promotions on the Offer Scorecard window, the system displays the View Promotion window for the selected promotion on the same tab. See Viewing a Promotion for more information.
-
-
Promotion ID – Contains the Title ID and the Promotion ID in parenthesis.
-
Start Date – The date the promotion begins.
-
End Date – The date the promotion ends.
-
Direct Revenue – Total extended price of all line items associated with the Promotion's Offers.
Promotion Revenue Comparison
Pie Chart
-
The pie chart shows the pictorial representation of the direct revenue generated from the respective promotions.
-
The title of the pie chart is Promotion Revenue Comparison.
-
The maximum of top ten promotions by direct revenue display.
-
Each sector of the pie chart represents the direct revenue earned by an individual promotion with a different color.
-
A legend displays to the right of the pie chart and is linked with the information displayed in the pie chart.
Note:
To close the Offer Scorecard, click the close icon X associated with the Offer Number in the Open Tasks area at the top of the window.
Engagements
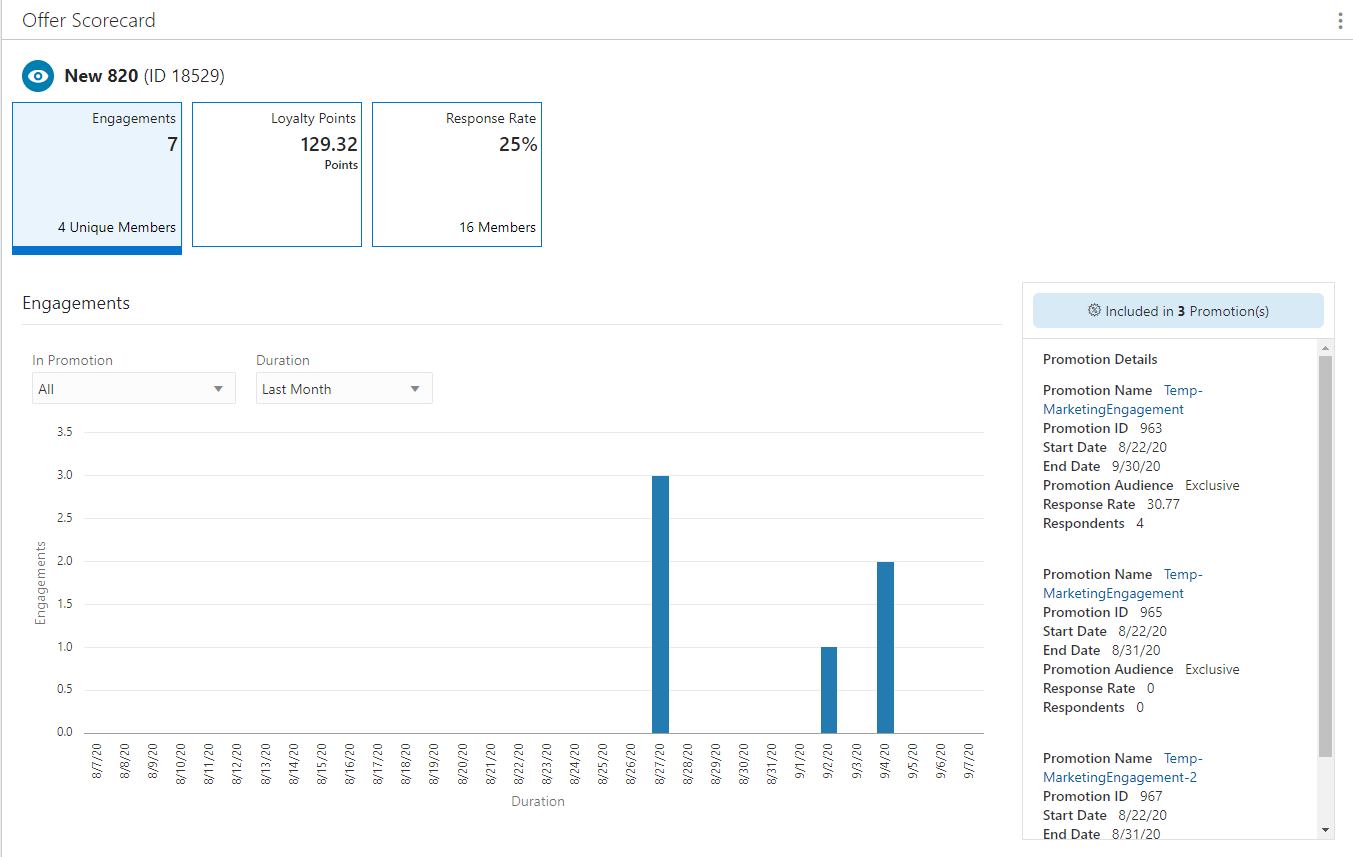
The number of times customers interact with marketing media, such as watching a video online.
Figure 6-69 Engagements Metric Tile
-
In Promotion - You can choose to view by All promotions (default) or select from the list of promotions associated with the offer.
-
Duration– Durations include:
-
Last Week - Offer performance for Last Week (7 days (Current date (-1)) display.
-
Last Month (Default) – Offer performance for Last Month (Current date (-1)) display.
-
Last 6 Months – Offer performance for Last 6 Months converted into weeks (Current date (-1)) display.
-
Last Year – Offer performance for Last 12 months (Current date (-1)) display.
-
Lifetime to Date – Offer performance for the last 5 years (Current date (-1)) display.
-
Graph
-
The bar graph will dynamically update the Offer performance based on the value selected for the In Promotion and Duration.
-
By default the Offer performance graph displays for All the Promotions which the Offer is part of for the Last Month.
-
The graph represents a plot between the Engagements on Y-axis and Duration on X-axis for each individual Promotion.
Promotion Details Side Panel
-
Promotion Name – Name of the Promotion.
-
Click the Promotion Name link from the Promotion Details panel on the Offer Scorecard window to display the View Promotion window for the selected promotion on the same tab. Click Done to return to the Offer Scorecard. See Viewing a Promotion to learn more about the information on that window.
-
-
Promotion ID – ID of the Promotion.
-
Start Date – The date the Promotion begins.
-
End Date – The date the Promotion ends.
-
Promotion Audience – Indicates the type of targeting used by the Promotion (Nonexclusive or Exclusive).
-
Response Rate – Calculated by dividing the total number of Respondents by the Total number targeted. Set to 100.00 for Non-Targeted customers.
-
Respondents – Number of Customers in the Target who have responded to the Offer in the Promotion. This is the same as the Total for Non-Targeted customers.
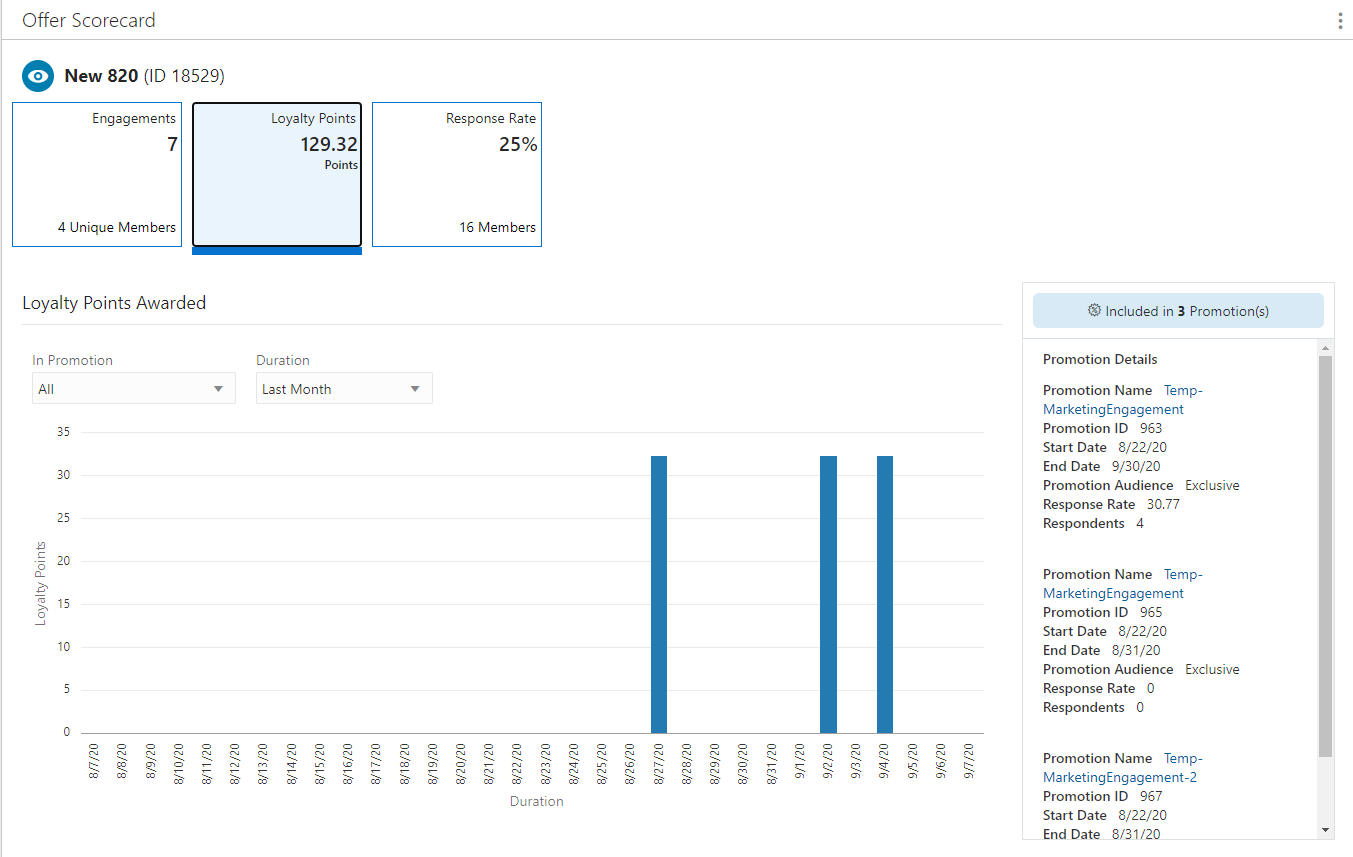
Loyalty Points
Total points issued during the Promotion period to the members against their purchase activity. The Points are calculated as defined in the Offers which is the part of this Promotion.
Figure 6-70 Loyalty Points Metric Tile
-
In Promotion - You can choose to view by All promotions (default) or select from the list of promotions associated with the offer.
-
Duration– Durations include:
-
Last Week - Offer performance for Last Week (7 days (Current date (-1)) display.
-
Last Month (Default) – Offer performance for Last Month (Current date (-1)) display.
-
Last 6 Months – Offer performance for Last 6 Months converted into weeks (Current date (-1)) display.
-
Last Year – Offer performance for Last 12 months (Current date (-1)) display.
-
Lifetime to Date – Offer performance for the last 5 years (Current date (-1)) display.
-
Graph
-
The bar graph will dynamically update the Offer performance based on the value selected for the In Promotion and Duration.
-
By default the Offer performance graph displays for All the Promotions which the Offer is part of for the Last Month.
-
The graph represents a plot between the Loyalty Points on Y-axis and Duration on X-axis for each individual Promotion.
Promotion Details Side Panel
-
Promotion Name – Name of the Promotion.
-
Click the Promotion Name link from the Promotion Details panel on the Offer Scorecard window to display the View Promotion window for the selected promotion on the same tab. Click Done to return to the Offer Scorecard. See Viewing a Promotion to learn more about the information on that window.
-
-
Promotion ID – ID of the Promotion.
-
Start Date – The date the Promotion begins.
-
End Date – The date the Promotion ends.
-
Promotion Audience – Indicates the type of targeting used by the Promotion (Nonexclusive or Exclusive).
-
Response Rate – Calculated by dividing the total number of Respondents by the Total number targeted. Set to 100.00 for Non-Targeted customers.
-
Respondents – Number of Customers in the Target who have responded to the Offer in the Promotion. This is the same as the Total for Non-Targeted customers.
Average Points Issued Per Transaction
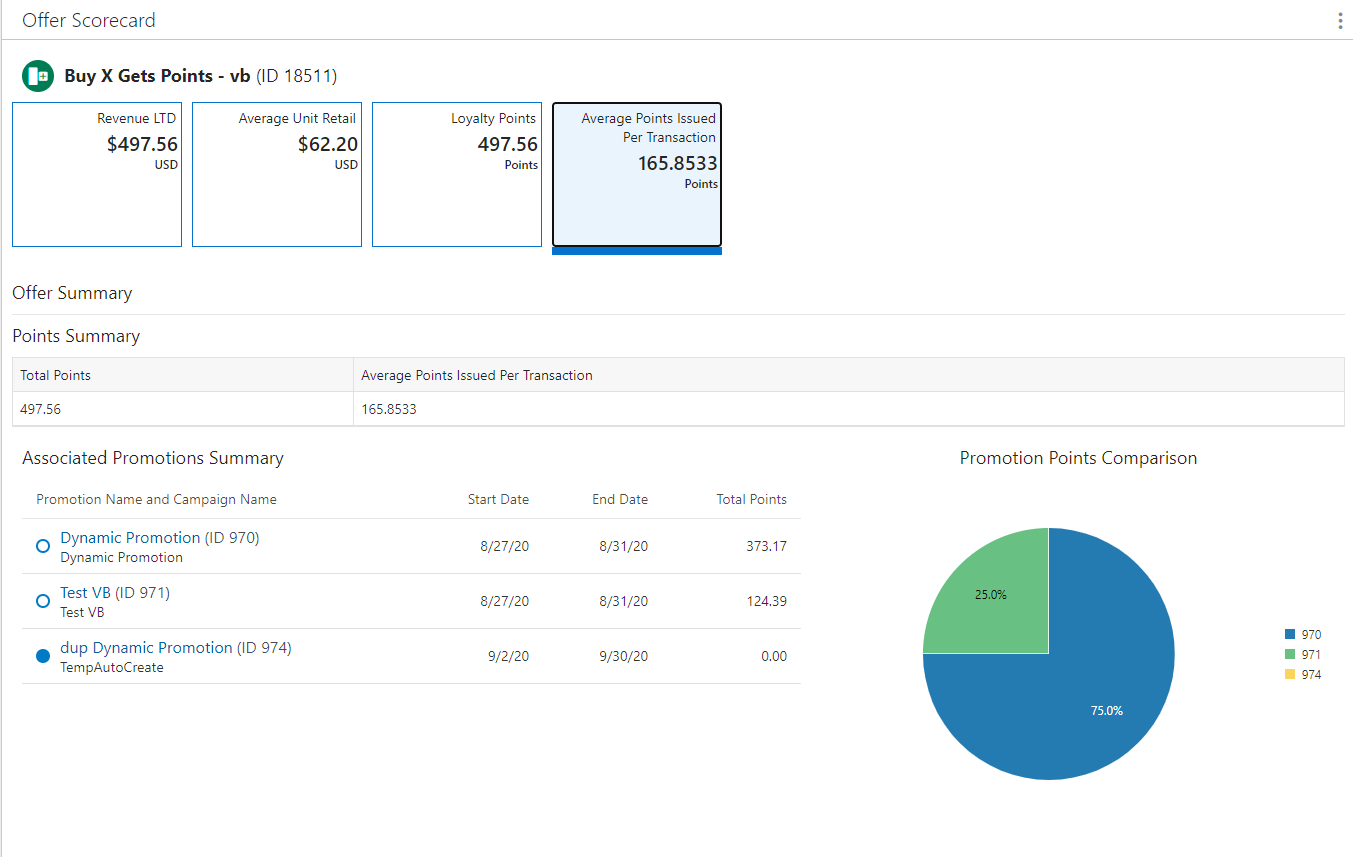
Average number of points issued per Transaction during the Promotion period to the members against their purchase activity. The Average Value (Total Points issued/Number of Transaction).
Figure 6-71 Average Points Issued Per Transaction Metric Tile
Offer Summary - Points Summary
-
Total Points – Sum Total of the Points generated using the offer.
-
Average Points Issued Per Transaction – Average number of points issued per Transaction during the Promotion period to the members against their purchase activity. The Average Value (Total Points issued/Number of Transaction).
Associated Promotions Summary
Data Section
-
A full circle represents an Active Promotion or an empty circle represents an Inactive Promotion.
-
Promotion Name and Campaign Name – Name of the Promotion and Campaign.
-
When a user selects the promotion name from the list of promotions on the Offer Scorecard window, the system displays the View Promotion window for the selected promotion on the same tab. See Viewing a Promotion for more information.
-
-
Promotion ID – Contains the Title ID and the Promotion ID in parenthesis.
-
Start Date – The date the promotion begins.
-
End Date – The date the promotion ends.
-
Total Points – Total points distributed with all the Promotion's Offers.
Promotion Points Comparison
Pie Chart
-
The pie chart shows the pictorial representation of the points distributed from the respective promotions.
-
The title of the pie chart is Promotion Points Comparison.
-
The maximum of top ten promotions by direct revenue display.
-
Each sector of the pie chart represents the points distributed by an individual promotion with a different color.
-
A legend displays to the right of the pie chart and is linked with the information displayed in the pie chart.
Note:
To close the Offer Scorecard, click the close icon X associated with the Offer Number in the Open Tasks area at the top of the window.
Response Rate
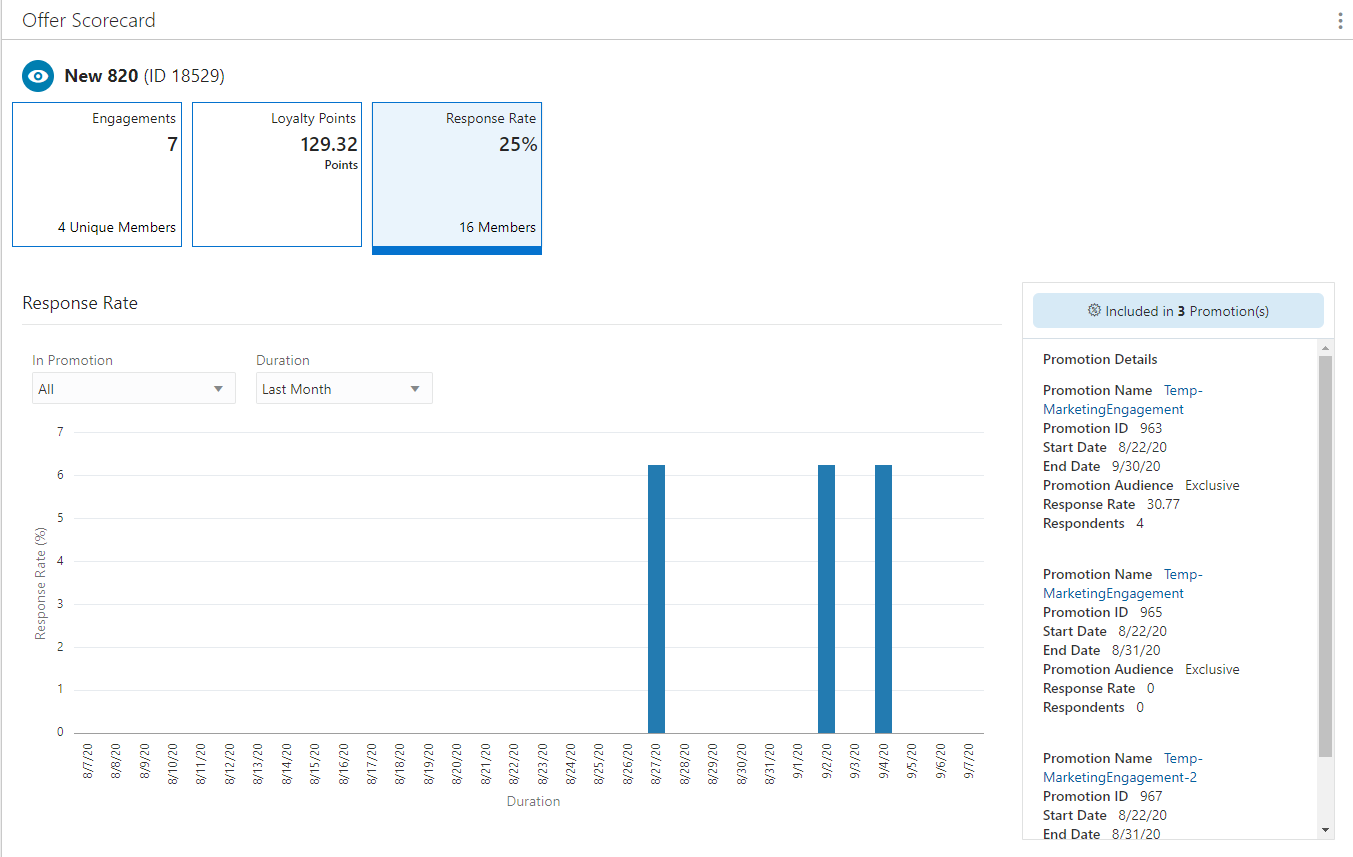
Calculated by dividing the total number of Respondents by the Total number targeted. Set to 100.00 for Non-Targeted customers.
Figure 6-72 Response Rate Metric Tile
Graph
-
The bar graph will dynamically update the Offer Response Rate based on the value selected for the In Promotion and Duration.
-
By default the Response Rate performance graph displays for All the Promotions which the Offer is part of for the Last Month.
-
The graph represents a plot between the Response Rate on Y-axis and Duration on X-axis for each individual Promotion.
Promotion Details Side Panel
-
Promotion Name – Name of the Promotion.
-
Click the Promotion Name link from the Promotion Details panel on the Offer Scorecard window to display the View Promotion window for the selected promotion on the same tab. Click Done to return to the Offer Scorecard. See Viewing a Promotion to learn more about the information on that window.
-
-
Promotion ID – ID of the Promotion.
-
Start Date – The date the Promotion begins.
-
End Date – The date the Promotion ends.
-
Promotion Audience – Indicates the type of targeting used by the Promotion (Nonexclusive or Exclusive).
-
Response Rate – Calculated by dividing the total number of Respondents by the Total number targeted. Set to 100.00 for Non-Targeted customers.
-
Respondents – Number of Customers in the Target who have responded to the Offer in the Promotion. This is the same as the Total for Non-Targeted customers.