Promotion Scorecard
The Promotion Scorecard displays information about the Customer response to a Promotion.
Viewing the Promotion Scorecard
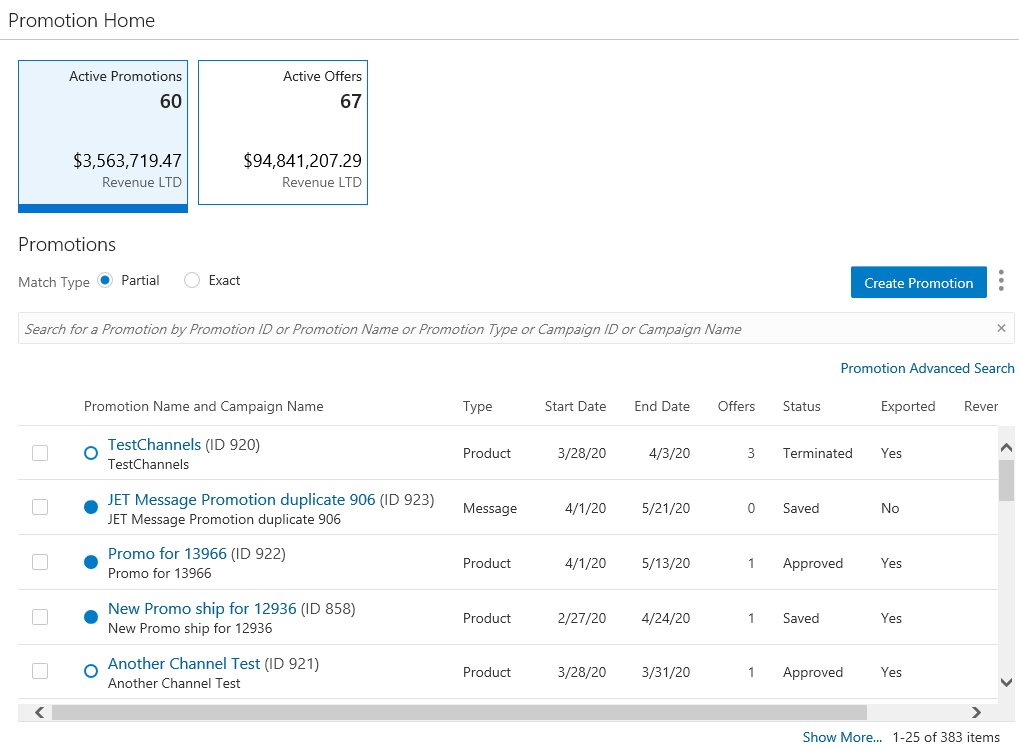
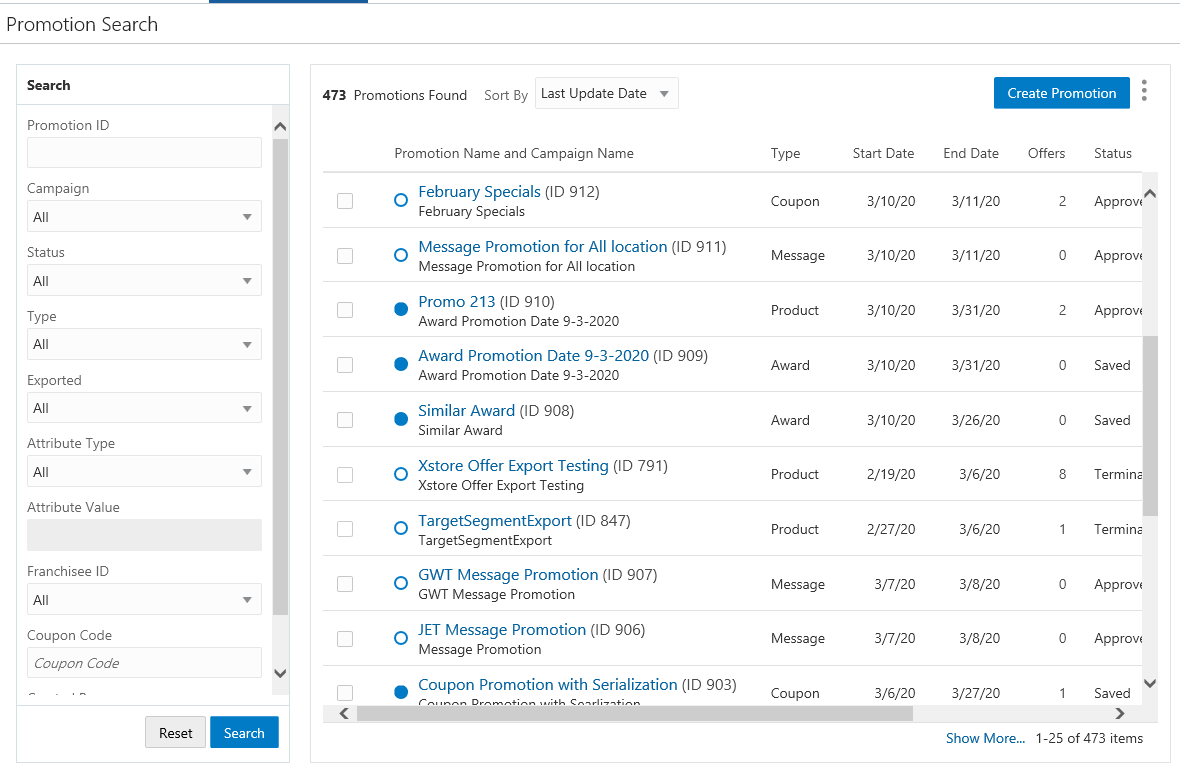
To access the Promotion Scorecard for summary information on a particular promotion, the user can select the link on the Promotion name on either the Promotion List or the Promotion Search results windows.
To access the Promotion List:
-
From the Main menu, click Tasks.
-
Click Campaign.
-
Click Promotion Home. This should default you to the Promotion List
Note:
You will need the Promotion Home role in order to see this menu option.
Figure 5-176 Promotion Home
To access the Promotion Search results window:
-
From the Main menu, click Tasks.
-
Click Campaign.
-
Click Promotion Search.
-
Enter criteria in the Search panel where you can search for a unique promotion, or click Search to retrieve all promotions.
Figure 5-177 Promotion Search
-
Select the link on a Promotion Name, which then opens the Promotion Scorecard for that promotion.
-
Click the Revenue LY Metric Tile to see the following information:
Figure 5-178 Promotion Scorecard - Revenue LY Metric Tile View
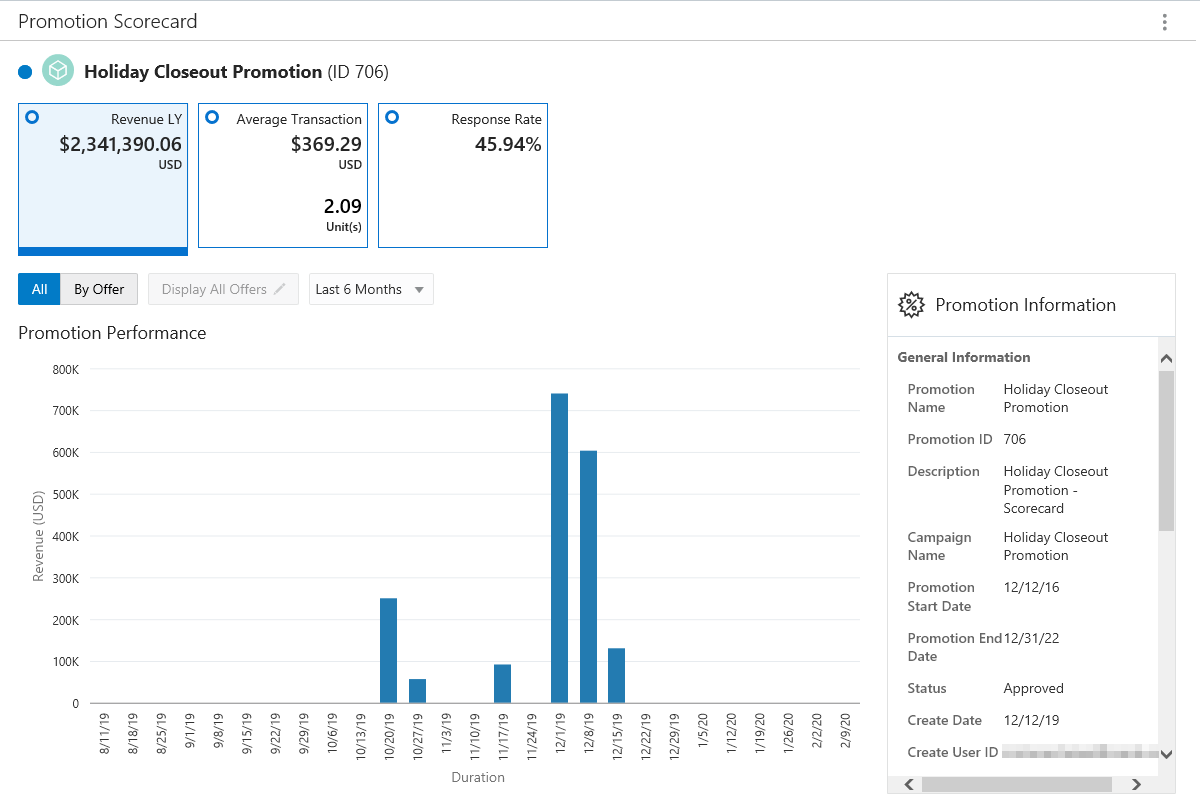
The Promotion Scorecard window displays the following sections:
-
Title section (displays on all windows) – this contains the name and ID of the Promotion as well as an indicator of whether the promotion is currently active or inactive (a solid Blue Dot represents an Active Promotion while an Empty Dot represents an Inactive Promotion).
-
Metric Tiles (displays on all windows) – The following metric tiles are included for the Promotion Scorecard:
-
Revenue LY
-
Average Transaction
-
Response Rate
-
Loyalty Points (Loyalty Only)
-
Average Points Per Transaction (Loyalty Only)
-
-
Filter/Sort Options
Filtering and sorting options for the Promotion Performance graph (displays only for the Revenue LY and Loyalty Points Metric tiles) - The following filter choices allow you to change the display in the Promotion Performance graph, and they include:
-
All – Displays total for All offers combined.
-
By Offer – Displays totals by individual offer.
-
Display all Offers – Filter the offers you wish to display in the Promotion Performance graph. This button is only available when By Offer is activated.
-
Figure 5-179 Filter Offers to Display
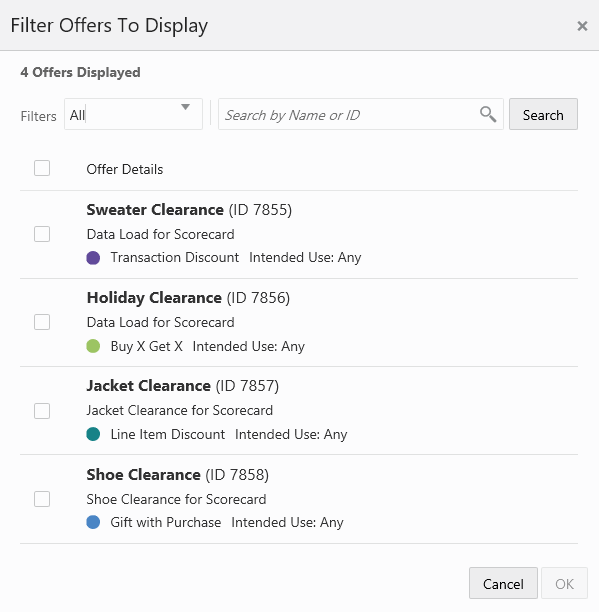
The Filters menu options on the Filter Offers to Display popup window will include the type of Offers that exist on the Promotion you are viewing.
-
In the Filter Offers to Display popup window, you can also search by Name or ID and click Search to retrieve the list of offers on this promotion.
-
From the list of filtered offers, select the check box for each offer you wish to display on the Promotion Performance graph.
-
Click OK to display the offers in the graph, or click Cancel to return to the Scorecard without saving any filters.
Duration
-
Last Week
-
Last Month (Default)
-
Last 6 Months
-
Last Year
-
Lifetime to Date – Offer performance for last five years
The Promotion Performance graph (displays only on the Revenue LY Metric tile) includes the following fields:
-
Revenue
-
Duration
The Promotion Information panel (displays only for the Revenue LY, Loyalty Points, and Average Points Per Transaction Metric tiles) See Promotion Information - Scorecards for more information.
-
-
Click the Average Transaction Metric Tile to see the following information:
Figure 5-180 Promotion Scorecard - Average Transaction Metric Tile Summary for a Product Promotion
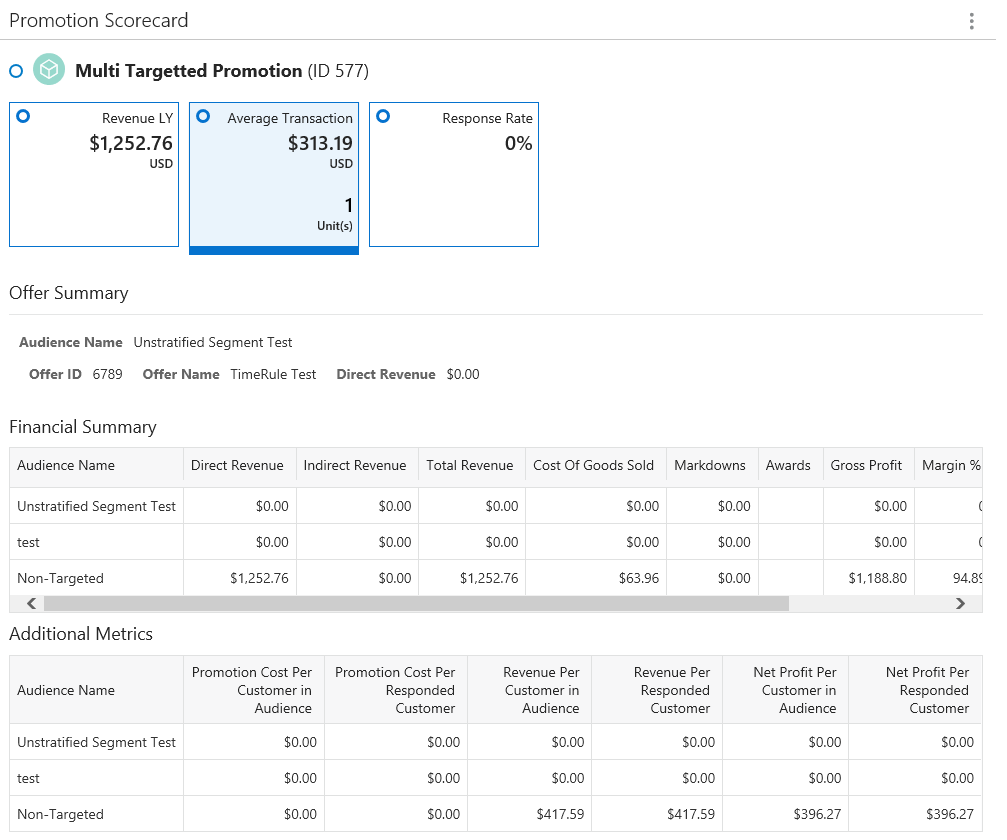
Offer Summary – data displayed will depend on whether the promotion is a Product or Coupon Promotion. Award and Message type Promotions will not display an Offer Summary section.
-
Audience Name
-
Offer ID
-
Offer Name
-
Direct Revenue
Financial Summary
-
Audience Name
-
Direct Revenue (Apply to Coupon Promotions Only)
-
Coupon Code
-
Respondents
-
Transactions
-
Value Of Discount
-
Average Sales By Coupon
-
Coupon Revenue
-
Estimated Distribution
-
Response %
-
-
Indirect Revenue
-
Total Revenue
-
Cost of Goods Sold
-
Markdowns
-
Awards
-
Gross Profit
-
Margin %
-
Promotion Cost
-
Net Profit
Additional Metrics
-
Audience Name – Name of the group of customers targeted for the Promotion.
-
Promotion Cost Per Customer in Audience – Cost of the Promotion per Customer targeted by the Promotion.
-
Promotion Cost Per Responded Customer – Cost of the Promotion per Customer who responded to the Promotion.
-
Revenue Per Customer in Audience – Revenue received from the Customers who were targeted for the Promotion.
-
Revenue Per Responded Customer – Revenue received from the Customers who responded to the Promotion.
-
Net Profit Per Customer in Audience – Net Profit from the Customers who were targeted for the Promotion.
-
Net Profit Per Responded Customer – Net Profit from the Customers who responded to the Promotion.
-
-
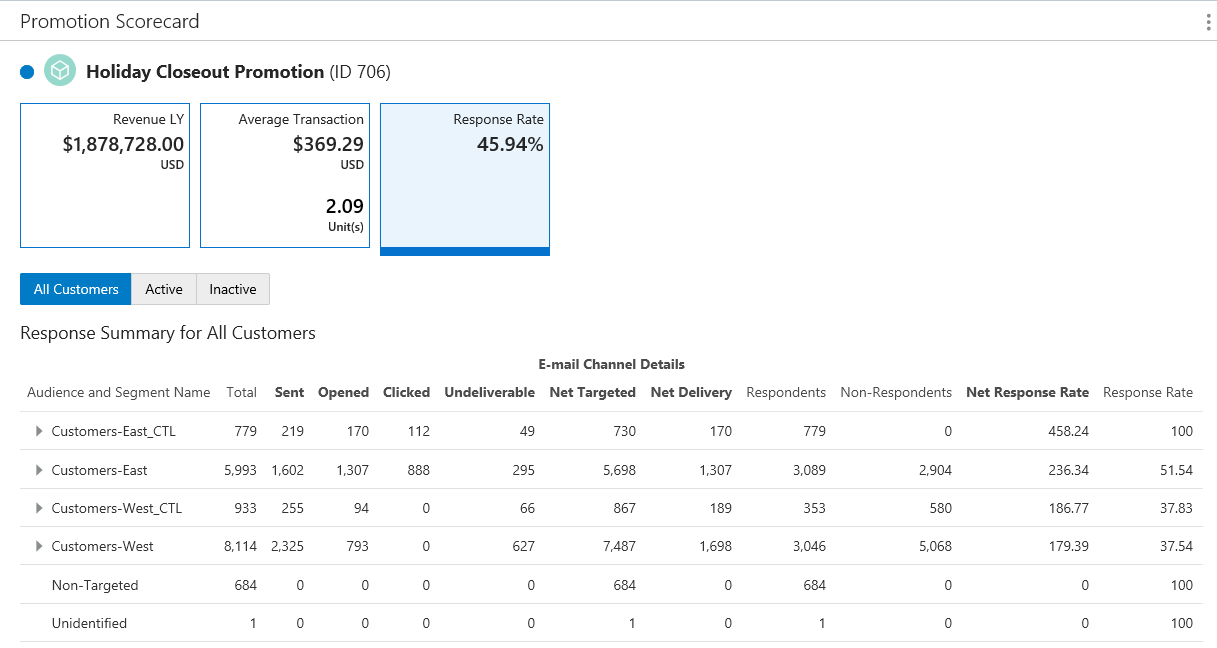
Click the Response Rate Metric Tile to see the following information which can be viewed by All Customers, Active, or Inactive:
Figure 5-181 Promotion Scorecard - Response Rate Metric Tile
-
Audience and Segment Name - Name of the target. A target name ending in _CTL indicates a control group. Non-Targeted is displayed as the Target Name for customers who responded to the Promotion but were not included in Target Groups.
-
Total - Number of Customers to whom emails were sent because they were in the Target Group. For Non-Targeted totals, this is the number of non-targeted customers who responded.
-
Sent - Number of emails sent. This total is 0 for Non-Targeted customers.
-
Opened - Number of emails opened.
-
Clicked - Number of emails clicked on.
-
Undeliverable - Number of emails that could not be delivered.
-
Net Targeted - Total customers - Undeliverable emails.
-
Net Delivery - Total number of emails Sent - Undeliverable emails.
-
Respondents - Number of Customers in the Target who have responded to the Promotion. This is the same as the Total for Non-Targeted customers.
-
Non-Respondents - Number of Customers in the Target who have not responded to the Promotion. This is 0 for Non-Targeted customers.
-
Net Response Rate - Calculated by dividing the total number of Respondents by the Net Delivery total. Set to 0.00 for Non-Targeted customers.
-
Response Rate - Calculated by dividing the total number of Respondents by the Total number targeted. Set to 100.00 for Non-Targeted customers.
-
Award Value - The total value of Awards issued through the promotion. Included only for an Award Promotion.
-
Redeemed Award Value - The total value of Awards redeemed. Included only for an Award Promotion.
-
-
Click the Loyalty Points Metric Tile to see the following information which can be viewed by All Customers, Active, or Inactive:
Note:
For Points Promotions, the Loyalty Tile displays differently. See Figure 5-183 followed by the description for this type of promotion.
Figure 5-182 Loyalty Points Metric Tile
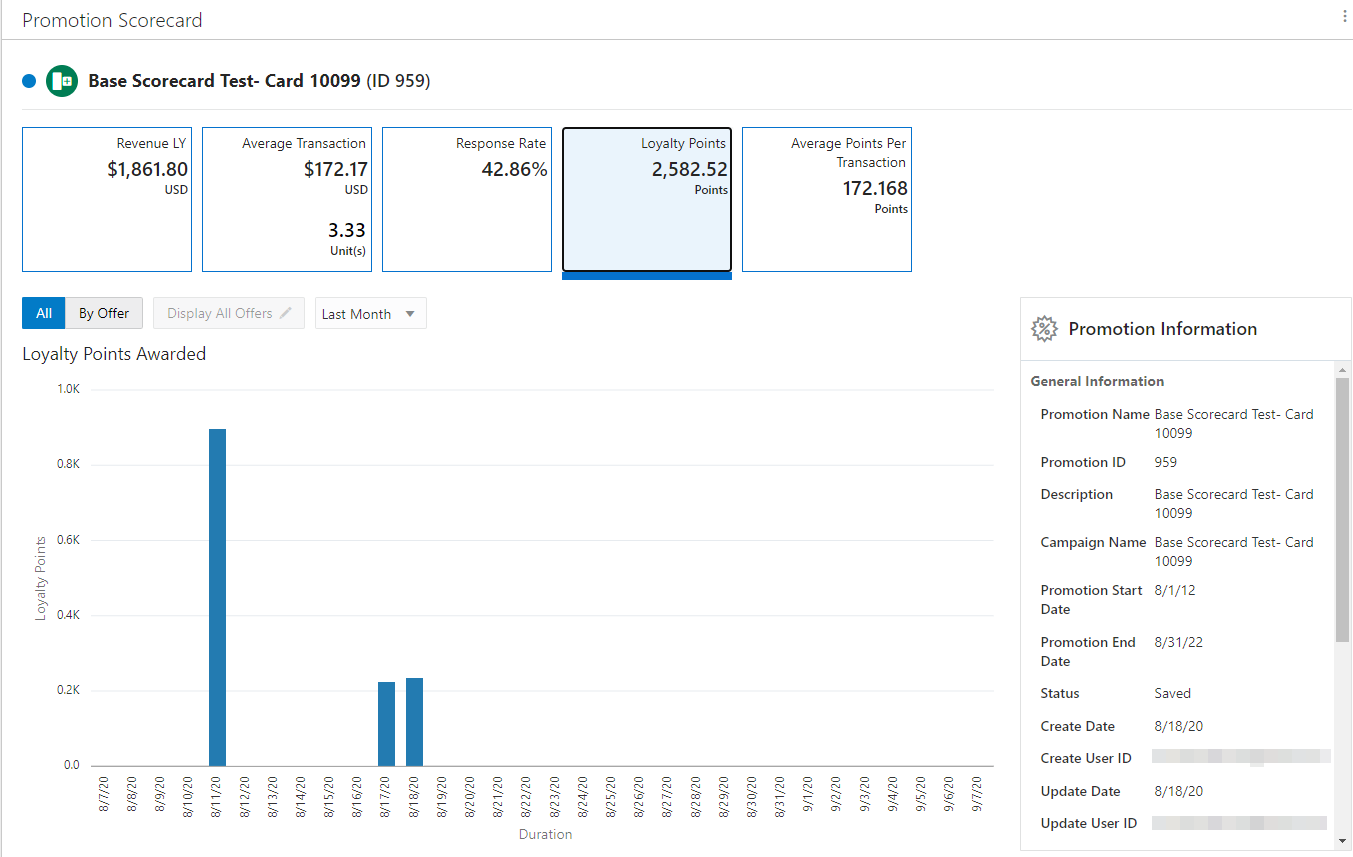
Graph
-
The bar graph will dynamically update the Loyalty Points Awarded based on the Offers selected and Duration.
-
By default the performance graph displays the offer details based on the time period selected for this promotion.
-
The graph represents a plot between the Loyalty Points on Y-axis and Duration on X-axis for each individual Promotion.
Note:
See Filter/Sort Options for sorting and filtering options for the Loyalty Points Awarded graph.
Figure 5-183 Loyalty Points Metric Tile - Points Promotion Scorecard
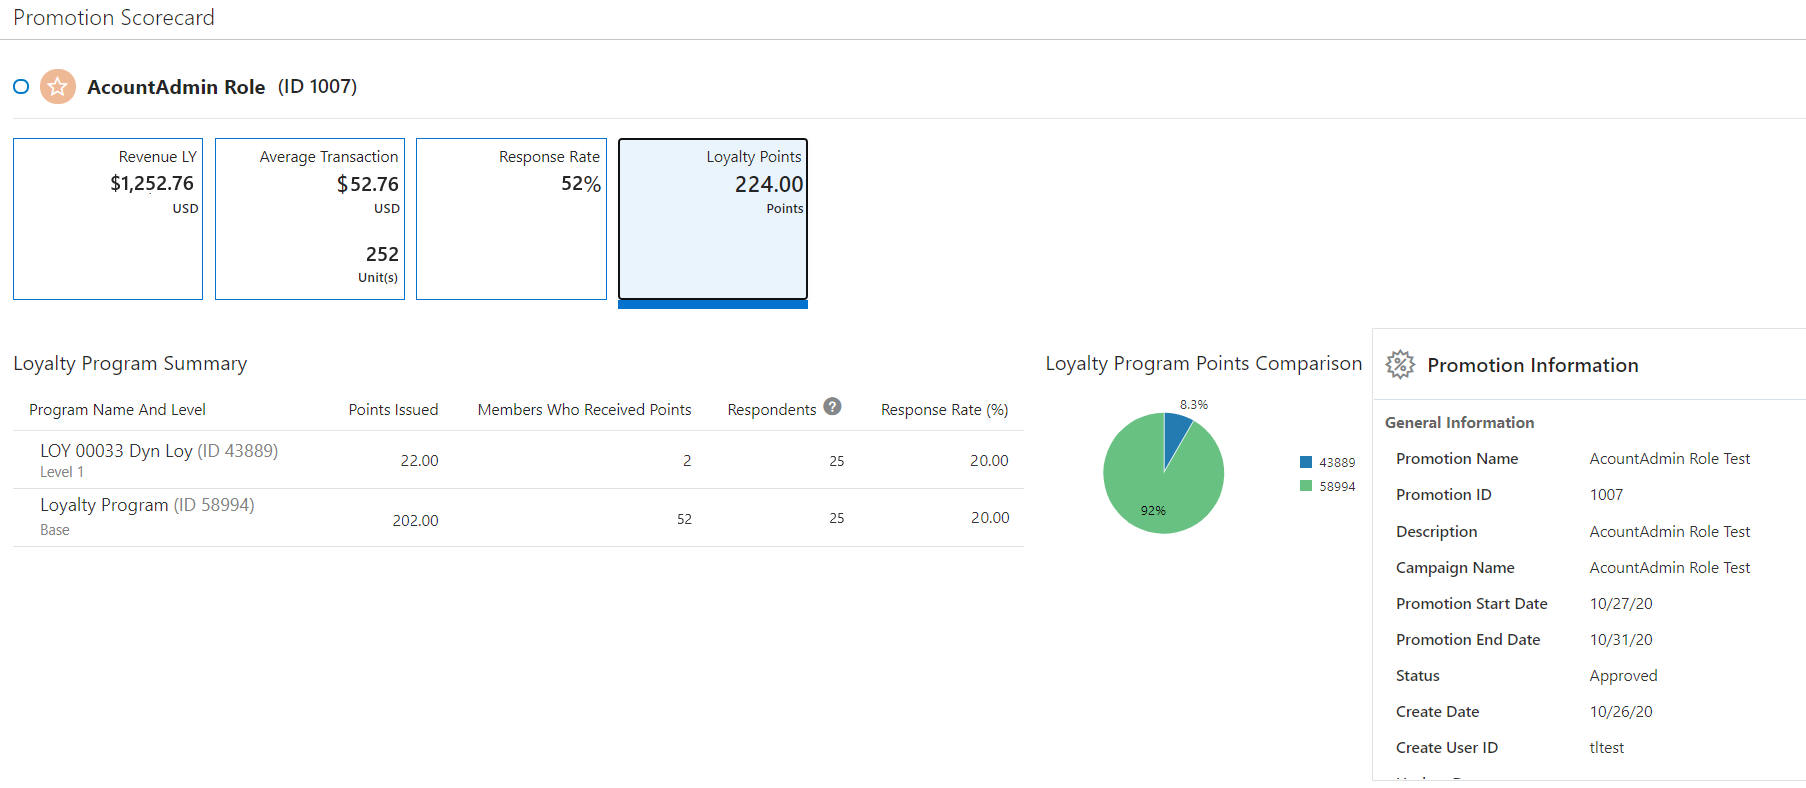
Note:
This is a promotion type specific to the loyalty program and issues loyalty points to specific card loyalty programs. The purchase totals are based on the selected customers/loyalty members receiving the Points promotion. There are no offers (triggering events) that are required to receive the points. The total purchases are based strictly on the customers that are part of the promotion. There are no items to exclude as we would do in the case of a promotion with offers.
Note:
The values displayed in the scorecard will include only indirect revenue. The indirect revenue is based on all purchases made by the customers that received loyalty points. This scorecard is used to analyze the stimulation in revenue based on issuing loyalty points. However, these transactions cannot be tied directly to specific purchases.
-
Loyalty Program Summary
-
Program Name and Level
-
ID
-
Points Issued
-
Members Who Received Points
-
Respondents - Members who received points that also made a purchase during this promotion period.
-
Response Rate {%}
-
-
Pie Chart
-
Calculates and displays the Total Points Issued by program and level.
-
Each sector of the pie chart represents the points awarded to the unique program and level with a different color.
-
The table lists all the levels, but the pie chart will only show the top ten based on points issued.
-
-
Promotion Information
-
General Information
-
Export / Approve Status
-
-
-
Click the Average Points Per Transaction Metric Tile to see the following information which can be viewed by All Customers, Active, or Inactive:
Figure 5-184 Average Points Per Transaction Metric Tile
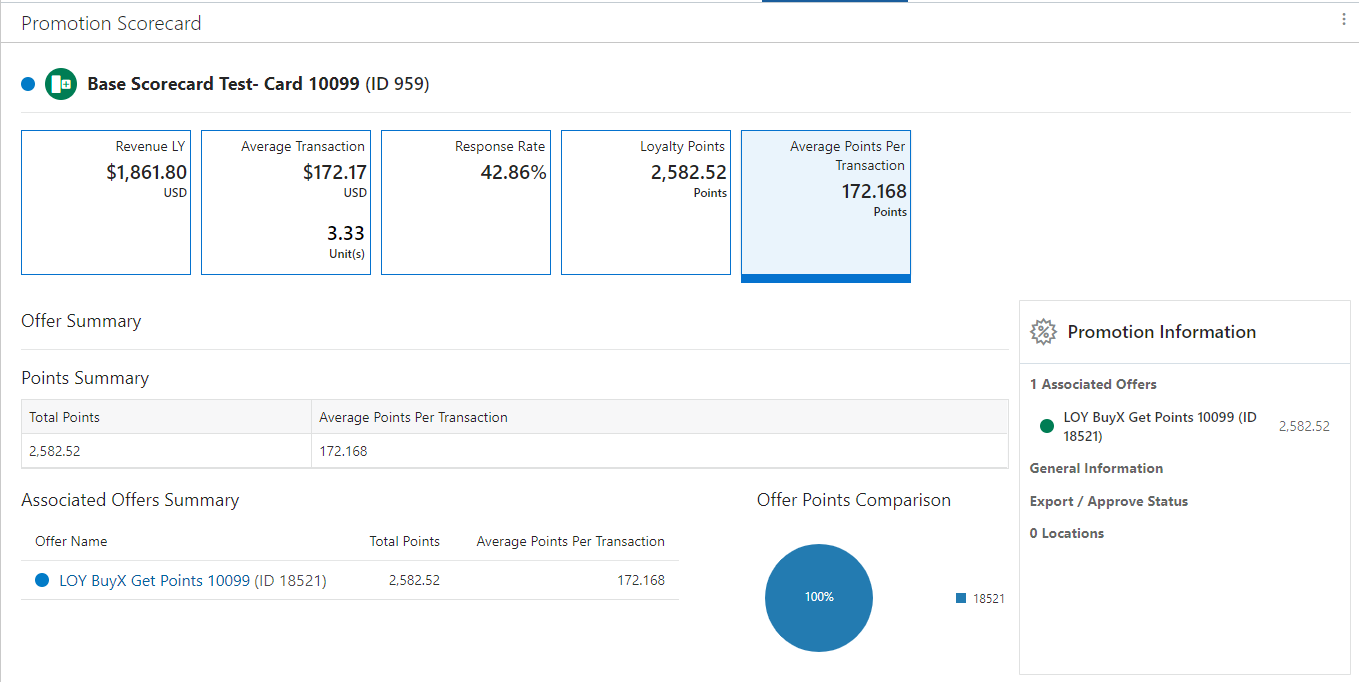
Offer Summary - Points Summary
-
Total Points – Sum Total of the Points generated using the offer.
-
Average Points Issued Per Transaction – Average number of points issued per Transaction during the Promotion period to the members against their purchase activity. The Average Value (Total Points issued/Number of Transaction).
Associated Offers Summary
-
A full circle represents an Active Offer or an empty circle represents an Inactive Offer.
-
Offer Name
-
When a user selects the offer name from the list of offers on the Promotion Scorecard window, the system displays the View Offer window for the selected promotion on the same tab. See Viewing Offers for more information.
-
-
Total Points - Total points distributed for the offer.
-
Average Points Per Transaction - Average number of points issued per Transaction during the Promotion period to the members against their purchase activity. The Average Value (Total Points issued/Number of Transaction).
Offer Points Comparison
-
The pie chart shows the pictorial representation of the points distributed from the respective offers.
-
The title of the pie chart is Offer Points Comparison.
-
The maximum of top ten offers by direct revenue display.
-
Each sector of the pie chart represents the points distributed by an individual offer with a different color.
-
A legend displays to the right of the pie chart and is linked with the information displayed in the pie chart.
Note:
To close the Promotion Scorecard, click the close icon X associated with the Promotion Number in the Open Tasks area at the top of the window.
-