System Logs
Users who have the System admin role can view the log events. Log events include:
-
Access
-
Data Privacy Audit
-
Duplicate Customer Merge
-
File Reader
-
File Transfer
-
Loyalty Points
-
Promote
-
Promotions
-
Quartz
-
Services
-
User Roles
-
Web Services
Viewing System Logs
To access the System Logs do the following:
-
Click Menu.
-
Click the Admin task.
-
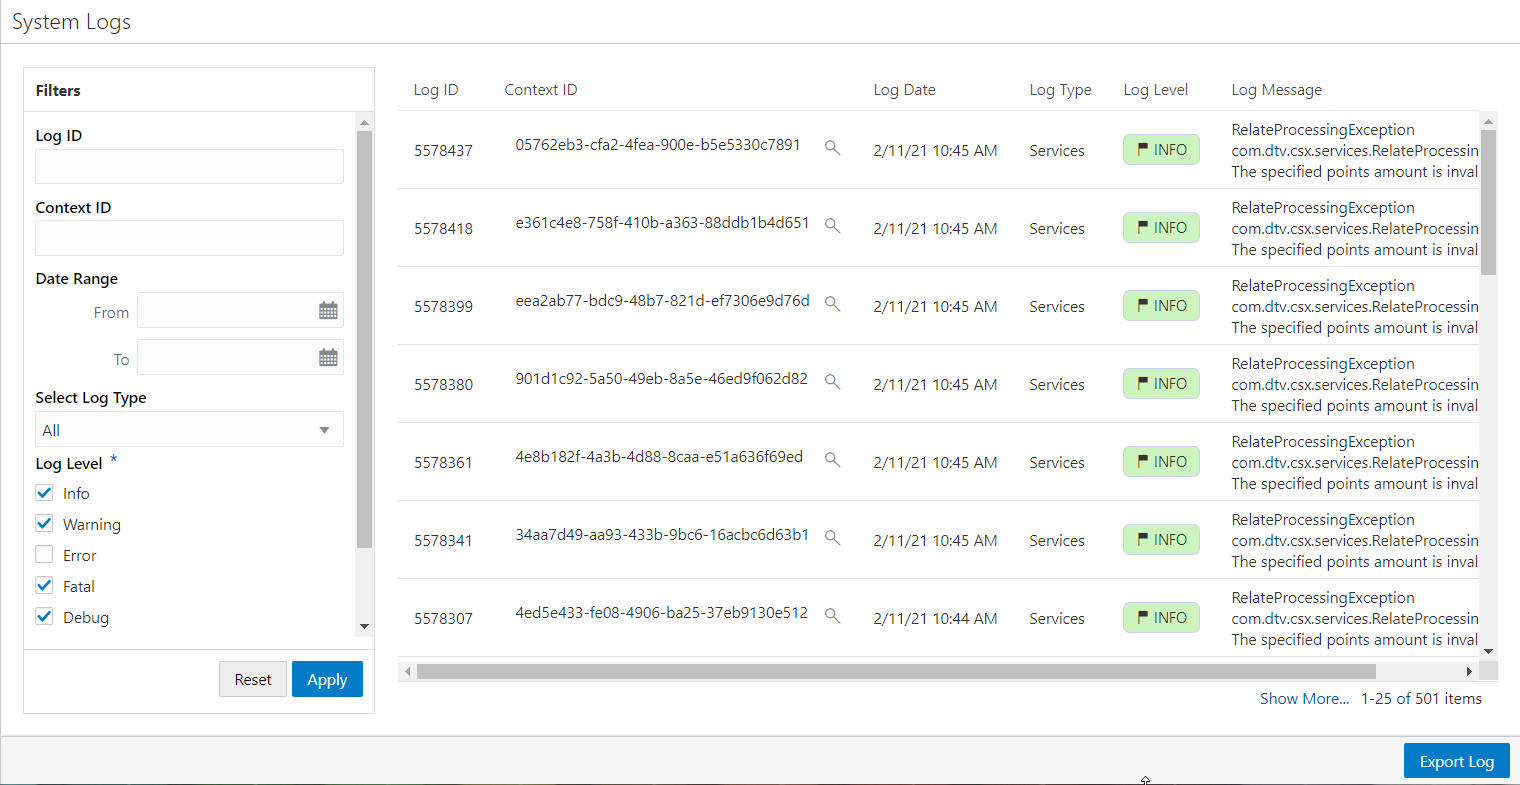
Click the System Logs task. The System Logs window displays.
The following fields are displayed:
-
Log ID – ID of the log.
-
Context ID – Diagnostic context information to correlate messages coming from a specific request or application.
-
Log Date – The date and time the log event was generated.
-
Log Type – The particular log containing the log event.
-
Log Level – The level of the log event recorded.
Colors as well as text are used to indicate the severity. They include:
-
Info - Pale Green
-
Warning - Pale Yellow
-
Error - Pale Red
-
Fatal - Red
-
Debug - Cyan
-
Trace - Grey
-
-
Log Message – The error message and first line of the recorded log event.
Figure 13-75 System Logs

Note:
The log events display in batches of 25 records. When more than 25 records are available, click Show More... to view more events up to a maximum of 500 records.
-
-
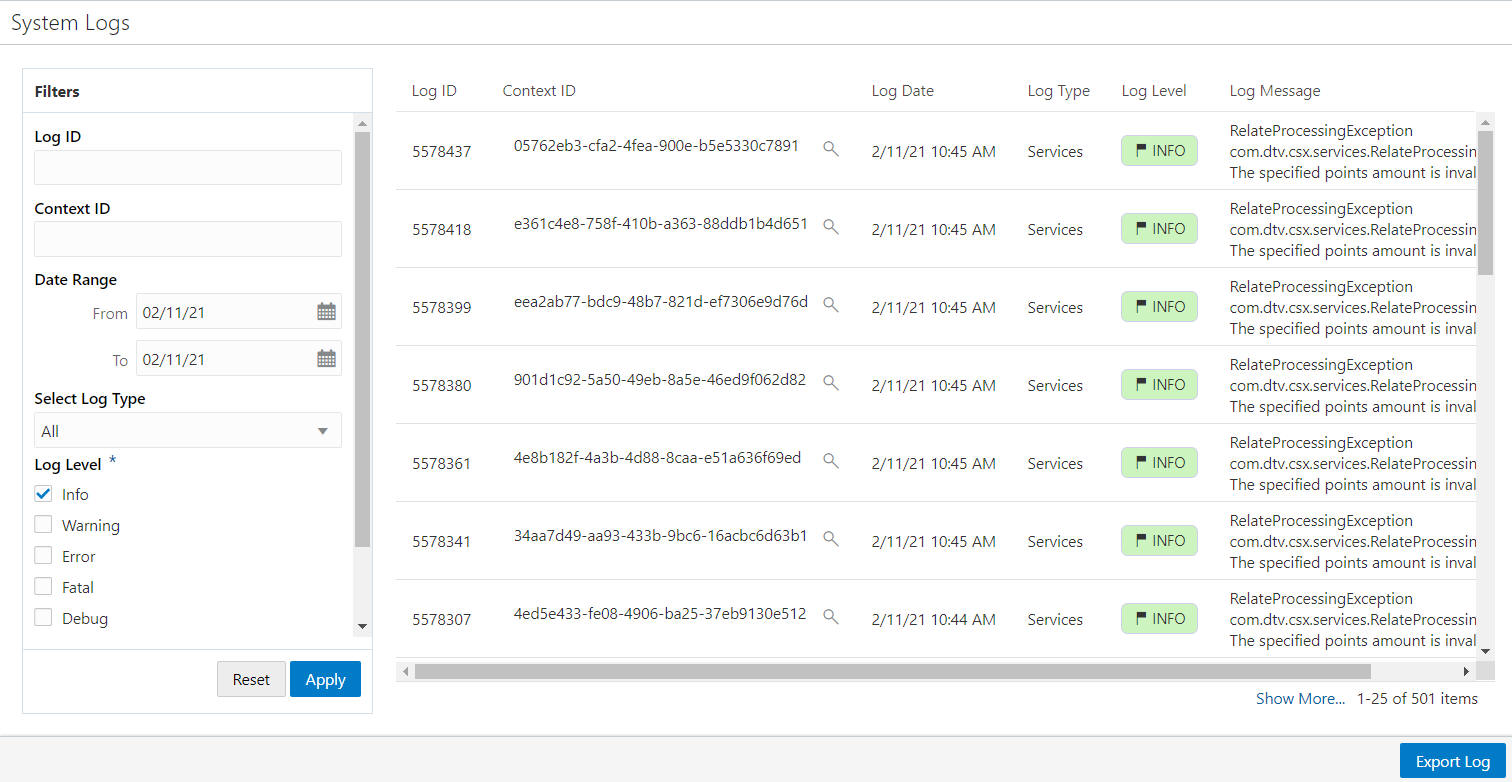
The Filters panel enables you to enter criteria to filter for a specific system log. Enter the desired filter criteria which includes the following fields:
-
Log ID – The log event sequence number.
-
Context ID – Diagnostic context information to correlate messages coming from a specific request or application.
-
Date Range From and To – The date range covering the log event.
-
Select Log Type – The particular log containing the log event. Default is All.
-
Access
-
Data Privacy Audit
-
Duplicate Customer Merge
-
File Reader
-
File Transfer
-
Loyalty Points
-
Promote
-
Promotions
-
Quartz
-
Services
-
User Roles
-
Web Services
-
-
Log Level – The level of the log event recorded. Default is to show all.
Log levels include:
-
INFO
-
WARNING
-
ERROR
-
FATAL
-
DEBUG
-
TRACE
-
-
Show Exceptions Only – Whether to show log events where an exception has been recorded or to show all log events. Default is Exception Only.
-
-
Click Apply to apply the filter criteria or, click Reset to clear any criteria changes back to the default filter criteria settings.
Exporting System Logs
Using the Export Log button creates an immediate job to export the log events to a downloadable file based on the filter criteria.
To export a system log perform the following actions:
-
Navigate to the System Logs window.
-
Enter the desired filter criteria for a specific system log or logs.
-
Click Apply to apply the filter criteria or, click Reset to clear any criteria changes back to the default filter criteria settings.
-
Click Export Log.
Figure 13-76 Exporting Logs

Note:
A message appears indicating success or failure.
Figure 13-77 Success Notification

The download link will be attached to the “Export System Logs" job in the task information panel found in the Job Management process queue.
The exported file will contain a file header:
>>>> Report Based On Criteria - , Log ID: Not specified From Date: Not specified, To Date: Not specified, Log Levels: [INFO, WARN, ERROR, FATAL, DEBUG, TRACE], Log Type: ALL, Context ID: Not specified <<<<
The header details the selection criteria used to generate the report.
The report detail contains the same information as displayed in the UI.