A Appendix: Forecast Approval Exceptions
This appendix provides the details on approval and navigation exceptions defined for the GA version of IPOCS-Demand Forecasting.
The exception management framework available in RPASCE works on several levels. First, the users refines the approval and navigation rules in the Business Rule Engine.
The forecast approval method is one of the following options:
-
Manual
The system-generated forecast is not automatically approved. Forecast values must be manually approved by accessing and possibly amending values in the Forecast Review workspace.
-
Automatic
The system-generated forecast is automatically approved as is.
-
By exception
This list contains the exceptions that were configured for use in the forecast approval process. They should match the dashboard exceptions and workspace alerts.
The unapproved product/locations are then assigned in order of priority to one of the following buckets:
-
Urgent
-
Required
-
Optional
-
Informational
Both the approval and navigation features can be configured to fit retailers' needs.
Then, the batch is run and the approval and navigation exceptions are worked out. Now it is time to review them and take actions. First there is the dashboard. You can review the approval exception tiles and see which business rules had a larger impact. The navigation exception profile displays how many production/locations are in each of the navigation buckets. This helps you plan your work when reviewing forecasts in order of priorities, assigned using business rules. From here you can open the Forecast Review workspace. Once in the workspace, you can decide how to review the forecasts. Every dashboard exception can have a workspace alert counterpart. You can navigate to product/locations that are flagged as exceptions, or you can use the workspace exceptions, that point you to cells where the business rules have been violated. This is possible because the workspace alerts have the time dimension while dashboard exceptions are at the production/location intersection, pointing you to the time series that needs attention.
The following details the GA approval alerts calculations.
Forecast versus Recent Sales
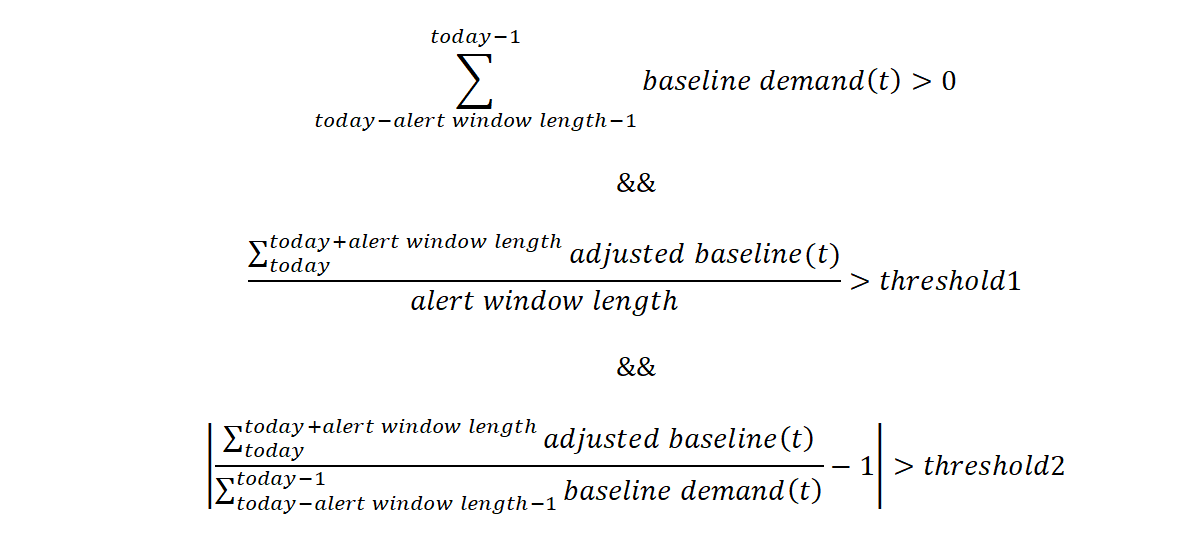
Usually it is not expected that demand values differ very much period to period. This also implies that the forecast magnitude generally is in line with the magnitude of the most recent sales. There are cases when this is not the case. For instance when an item enters a season, the forecast is probably higher than the sales in periods leading to the season. Or when an item is towards the end of the season, the forecast will be lower than sales in peak periods. For these cases, the user can be alerted to review the forecast, rather than auto approving it.
The following is the alert expression:

Where length, threshold1, and threshold2 are adjustable parameters.
Note how the calculations are not performed for the entire forecast horizon, but rather by the number of periods determined by the length parameter. The reason is that the forecast horizon can sometimes be very long; for example, 52 weeks, and average demand over such a long time period cannot be used as in-season versus out of season rate of sales.
Adjusted versus Approved
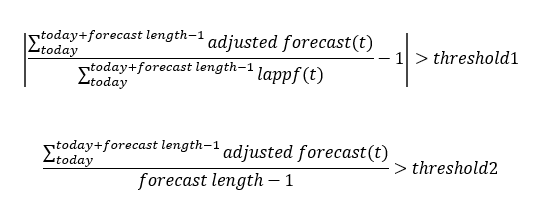
IPOCS-Demand Forecasting is typically set up to generate forecast weekly. Every week, new sales data is loaded, the forecast is regenerated. While the latest data points are expected to make the forecast more accurate, it is not expected that the difference in forecasts generated in two consecutive weeks to vary too much. If the forecasts differ, the user is alerted to review the forecasts.
The following is the alert expression:

Where threshold1 and threshold2 are adjustable parameters.
Note how summation of forecasts is not performed over the entire forecast length. It is stopped one period prior the forecast horizon ends, because this is the last populated period of the last approved forecast.
Forecast versus Last Year Sales
The most reliable forecasts are generated from data that has a repeatable pattern year over year. However, this is not always the case. A change in business strategy, merchandise reclassifications, New Items can all lead to changing selling patterns over time.
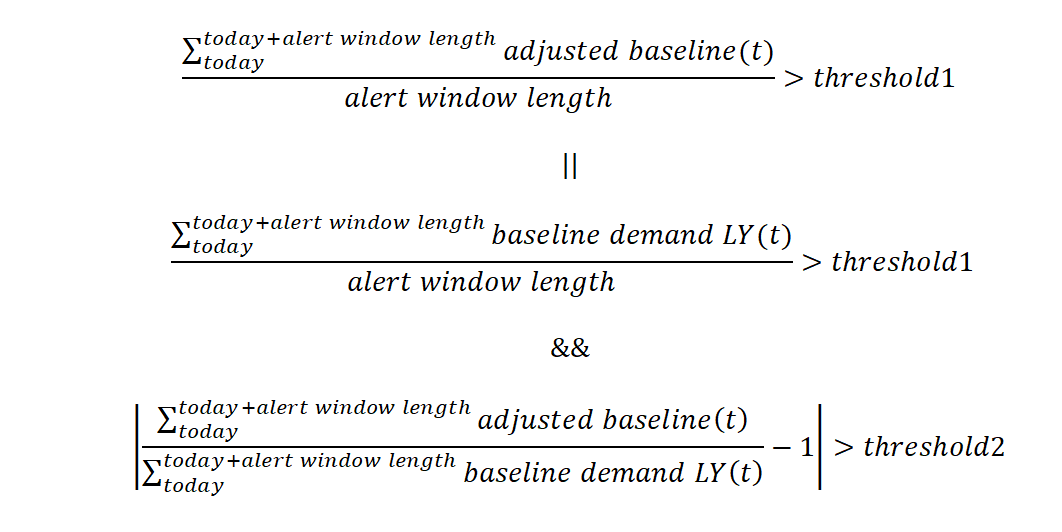
To detect possible changes in selling patterns, the following alert will compare the last year's sales volume with the forecasted sales volume. If they are different by an adjustable percent, the alert is triggered.
The following is the alert expression:

Where threshold1 and threshold2 are adjustable parameters.
First we check if the forecast is close to the sales LY. If it is, no alert is triggered. If it is not, we check the rate of sales of the item. If the item is selling consistently, we trigger an alert. If the sales and forecast are different, but the rate of sales of the item is not significant - defined by threshold2, no alert is triggered. This way we avoid prompting the user to review forecasts for low selling items.
Promo Peaks
The purpose of this alert is to check how large the forecast peaks are compared to historical demand. The peaks can come from various effects like promotions, price discount, demand transference due to assortment changes, and so on. The most common, though, are due to price changes and promotions.
The following is the alert expression:

Where the Causal Peak Factor is an adjustable parameter.
The business case this addresses is to alert you when the peaks in the forecast region are larger than any observed sales in the past. There may be valid justification for this, for instance, several events are active in the same time period, thus creating a huge spike in demand. You can review the alert and take action.