8 Offer Analysis Task
This chapter describes the Offer Analysis task for IPOCS-Demand Forecasting.
Offer Analysis Workspaces, Steps, and Views
The following table lists the workspaces, steps, and views for the Offer Analysis task.
Table 8-1 Offer Analysis Workspaces, Steps, and Views
| Workspace | Step | Views |
|---|---|---|
Offer Analysis Workspace
The Offer Analysis workspace allows you access to all of the views listed in Offer Analysis Workspaces, Steps, and Views.
It allows you to review how certain events have performed historically. The current promotion model consists of campaigns, which are a collection of promotions. Each promotion has one or more active offers.
Examples of this event structure are listed in the following table.
| Campaign | Promotions | Offers |
|---|---|---|
|
Winter 2024 |
TV Ad December |
Multiple Buys Gift with purchase |
|
Price Discount February |
Buy One Get One 20% off any collection |
The information is useful to review at any of these levels, but it is at the offer level where the impact on demand is quantified inside the forecast engine. It is then aggregated across offers to present the data per promotion, and across promotions to see how well the campaign did. All information in this workbook is historical. Offer information for the forecast (as it impacts future demand) is presented in the Forecast Review workbook. When reviewing the forecast, you can select how similar offers performed in the past and include additional information for the approval process in addition to the business rules set up for exception management.
To build the Offer Analysis workspace, perform these steps:
-
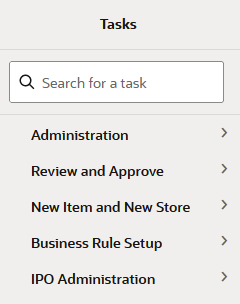
From the left sidebar menu, click the Task Module to view the available tasks.
Figure 8-1 Task Module

-
Click the Review and Approve activity and then click Promotion Analysis to access the available workspaces.
-
Click Promotion Analysis. The wizard opens.
You can open an existing workspace, but to create a new workspace, click Create New Workspace.
Figure 8-2 Offer Analysis Wizard
-
Enter a name for your new workspace in the label text box and click OK.
Figure 8-3 Enter Workspace Label
-
The Workspace wizard opens. Select the items you want to work with and click Next.
Figure 8-4 Workspace Wizard: Select Items
-
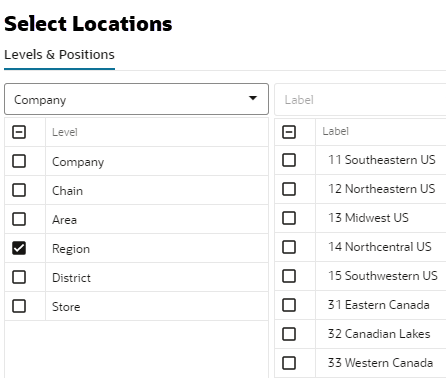
The Workspace wizard opens. Select the locations you want to work with and click Next.
Figure 8-5 Workspace Wizard: Select Locations

-
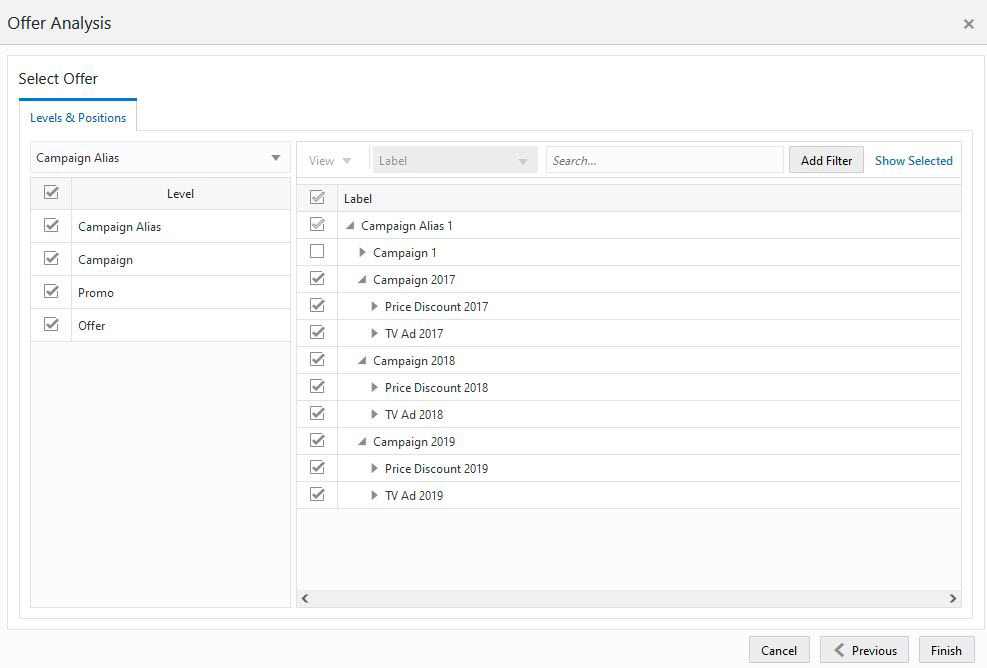
Select the offers you want to work with and click Finish.
Figure 8-6 Workspace Wizard: Select Offers

-
The wizard notifies you that your workspace is being prepared. Successful workspaces are available from the Dashboard.
Figure 8-7 Successful Workspace Build
The Offer Analysis workspace is built. This workspace contains this step:
Offer Analysis Step
The available views are:
Summary View
The Summary view allows you to review campaign/promo/offer data at a level in the product and location hierarchies that is higher than item/store. For a more detailed look, the same measures presented in this view can be reviewed in the Detailed View.
Figure 8-8 Summary View
Measures: Summary View
The Summary view contains the following measures.
Baseline Sales Units
This measure displays the sales units that would have been sold during the offer period if no reward was active.
Markdown Sales Units
This measure displays clearance units sold during the offer period.
Offer Sales Units
This measure displays the additional sales units sold during the offer period due to the offer reward.
Reward Type
This measure displays the mechanism used during the offer period to drive additional demand. The reward types available are:
-
Percent off: Price discount from the original price. Let's say the original price is $9.99, and the discount is 15%. During the offer the price at which items were sold is $8.49
-
Amount off: Amount off from the original price. Let's say the original price is $9.99 and the amount off is $2. During the offer the price at which items were sold is $7.99.
-
Fixed price: The price at which an item was sold. No matter what the original price is, the fixed price is what the items were sold for.
Effective Discount
This measure displays the actual discount offered during the offer period, no matter what the reward type was. This is a very important metric, since it is probably the main driver of the additional demand produced during an offer. It is also not always trivial to calculate. For example, for a Buy One Get One Free offer one would think the discount is 50%. However, not everybody buys an even number of items, even when this offer is active. This will actually lower the effective discount to be less than 50%.
Offer Start Date
This measure displays the date when the offer period started. This measure is displayed at an aggregate level, and let us say that some stores have different offer start dates, due to different weather in their geographic location. The date displayed is the earliest of the available dates.
Offer End Date
This measure displays the date when the offer period ended. This measure is displayed at an aggregate level, and let us say that some stores have different offer start dates, due to different weather in their geographic location. The date displayed is the latest of the available dates.
Offer Length
This measure displays the number of dates the offer was active. It is the number of days between the offer end and start dates.
Product Count
This measure displays how many items were part of the offer.
Location Count
This measure displays how many stores were part of the offer.
Detailed View
The Detailed view has the exact same metrics as the Summary View. The difference is that the Detailed view has the information displayed at the item/store level, while the Summary View shows it at a higher level in the product and location hierarchies.