Sales Report Sample
This example shows how tabular data can be presented as a chart within a report template.
-
Open a new Word document and load the XML data to be used by clicking Load Data / Sample XML within the BI Publisher ribbon.
-
Locate the RetailSales.xml file from RTF Templates / Sales Report / Retail Sales.rtf in the same location as Step 1.
-
Click Open. You should receive a Data loaded successfully message.
-
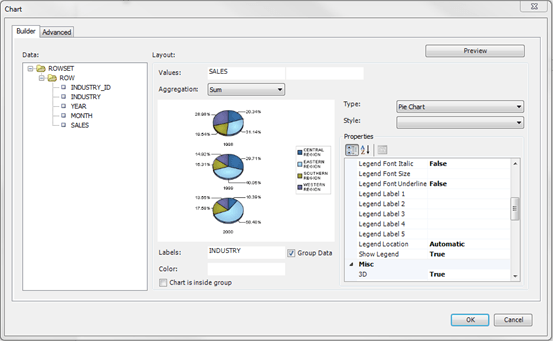
Now select Insert / Chart to open the Chart dialog box.
Figure B-9 Chart Dialog Box

-
Drag Sales in the left hand pane to the Values field to set data to be shown, and drag Industry to the Labels field to set how the values are to be accumulated.
-
Click Preview to see how the chart will be presented.
-
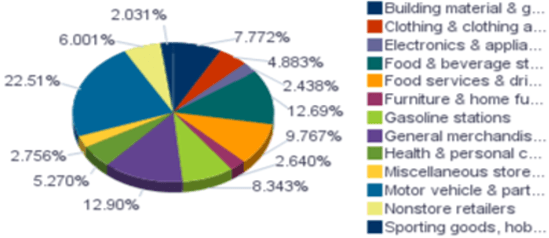
Click OK. The chart will be inserted into the form per Figure B-10.
Figure B-10 Sales Report Chart

The size of the chart can be changed by resizing the placeholder image.
-
The form can now be previewed as a PDF file by clicking Preview / PDF, or as any of the other formats.
-
Save a local copy of the completed RTF template.