Using the Dashboard
The goal of the dashboard is to automatically show timely sales data information collected from various areas within the organization-in one place. The data shown on the screen is an analysis as to how your business is operating; using graphics, summaries, and lists to display the information.
Information shown on the Dashboard includes:
-
Sales Performance - WTD, MTD, and YTD values as a running totals section, up to and including the current day's sales
-
Net Sales for the Top 5 Departments from today
-
The top 5 best-selling items from today
-
The top 5 sales associates from today
-
Store Goals performance data
In addition to the information displayed on the page, menu options are provided to allow you to view and print the Flash Sales report, the Daily Sales report, the Best Sellers report, and the Employee Tasks report.
To view the dashboard, select the Dashboard option from the Reporting menu.
Dashboard Information
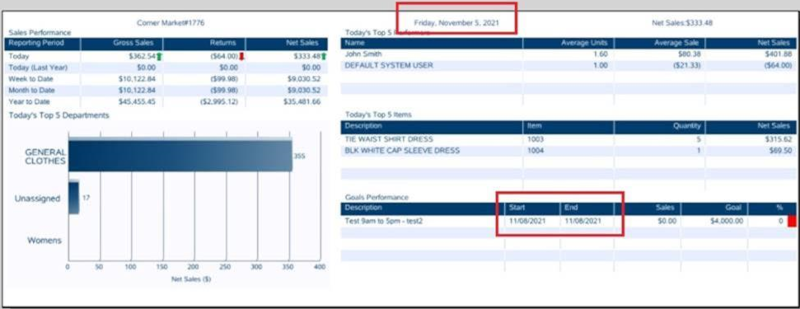
The Dashboard screen is divided into several informational areas as shown in the figure below:
Figure 60-13 Dashboard Screen

Dates
Generally, when a store is closed each night, the system date (current calendar date) and the business date will be the same. In cases of 24/7 trading, when the store is not closed for the night and reopened the next morning, the system date and business date will not be the same date. The business date remains unchanged, and the system date reflects the current calendar date.
For example, the date shown on the top of the report (dashboard) is Friday November 5, 2021. This is the business date.
The date highlighted in the Goals Performance area shows the start and end dates as 8 November. This reflects the system date, that is, when the report was run.
Sales Performance
This section shows the Gross Sales, Returns, and Net Sales for Today, a year ago (Today - last year), Week-to-Date, Month-to-Date, and Year-to-Date. The data displayed in this section is a running totals section. This information shows the current day's sales in near real time, so these values change depending on when the Dashboard is displayed.
Note:
Additional 'sales data is available on the Flash Sales and other Sales reports.
Top 5 Departments
This section shows a graph representing the top 5 department sales. One axis of the graph shows the Net Sales dollars, and the other shows the Department ID.
Top 5 Performers
This section shows the top 5 sales associates from today, listed in descending order, based on Net Sales dollars. In addition to Net Sales dollars, the Units per Transaction (UPT), and Average Sale dollars are also displayed.
Note:
How the UPT and Average Sale data are calculated:
Units per transaction = total units sold/# of transactions
Average Sale = Net Sales/# of transactions