EV Post-Bill Report Main Insight Module
The EV Post Bill Report Main Insight module provides the reader with an overview of their electric vehicle (EV) charging during the most recent billing period. The module identifies how much they spent charging their vehicle, provides tips to improve their charging habits, and explains how the utility tracks EV charging data.
Requirements
There are no module-specific requirements. For product requirements, see Requirements and Limitations.
User Experience
This module includes the following components.
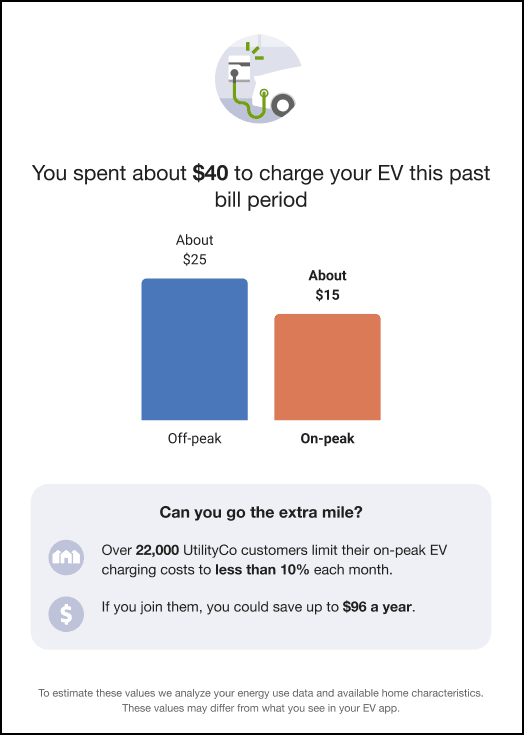
Image: The EV charging image appears at the top of the module.
Spending Statement: Below the image, a statement provides the total cost of charging the EV during the billing period. For example, for people who charged more than 10% of the time during peak hours, the statement might read "You spent about $40 to charge your EV this past bill period".
Charging Graph: Below the rating statement, a graph depicts how much the reader spent on on-peak and off-peak charging during the billing period.
Incentive Statement: For customers who charged more than 10% of the time during peak hours, the module includes a section that asks the reader if they can improve their charging habits so they receive a great rating. For example, the header states "Can you go the extra mile?" The module then provides information about the average charging habits of other customers at the utility. This statement begins with a graphic depicting several houses, and reads "Over 22,000 UtilityCo customers limit their on-peak EV charging costs to less than 10% each month." The last section of the statement begins with a dollar sign graphic, and tells the reader how much they can save, based on their charging this month, if they charge mindfully. For example, "If you join them, you could save up to $96 a year."
Explainer Statement: Below the incentive statement, the explainer statement tells the reader how the utility determines their EV charging information. For example, "To estimate these values we analyze your energy use data and available home characteristics. These values may differ from what you see in your EV app."
User Experience Variations
This topic discusses how the module can vary.
Chart Display Variations
The chart in the module varies as follows, depending on whether the customer has 2 or 3 periods in their rate plan:
- When the customer's rate plan includes two periods, the chart displays two bars.
- When the customer's rate plan includes three different periods, the chart displays three bars.
Low On-Peak Charging
For customers who had less than 10% of their EV charging during on-peak hours, the module varies as follows:
- Spending Statement: The statement changes to read "You did great with you on-peak EV charging this past bill period!"
- Incentive Statement: This statement is removed from the module.