Flat Rate Disaggregation Module
The Flat Rate Disaggregation module helps utility customers better understand how they are using electricity during each week or billing period, depending on which email the module is included in. By identifying the top three categories of energy consumption, the module brings visibility to which appliances use the most energy. The module displays the top 3 quantified end uses for the customer.
For utilities, this module provides a clear and actionable way to engage customers in helping them understand how energy is used in their household, and how they can shift usage to off-peak times to help relieve demand on the grid.
Quantified End Uses: End uses for which our disaggregation algorithms are able to provide an accurate estimate of how much of the appliance a customer was using during peak hours, and therefore, can be associated with a specific metric, such as kWh, percentage, or cost. The top three of these appliances are presented in the module.
Note:
Whether a category is quantified is determined by the data that is available from the utility and by the disaggregation model.
Requirements
This section discusses customer requirements and limitations.
Customer Requirements
| Category | Description |
|---|---|
|
Data Requirements |
AMI (hourly or more granular) data. There are additional AMI data requirements to show advanced insights such as appliance-level disaggregation. Contact your Delivery Team for more information. |
|
Data History |
AMI data for at least one period. |
|
Data Coverage |
The customer must meet the default scored AMI data threshold and may not exceed the maximum number of missed AMI reads for the billing period. Contact your Delivery Team for more information. |
User Experience
This module includes the following components:
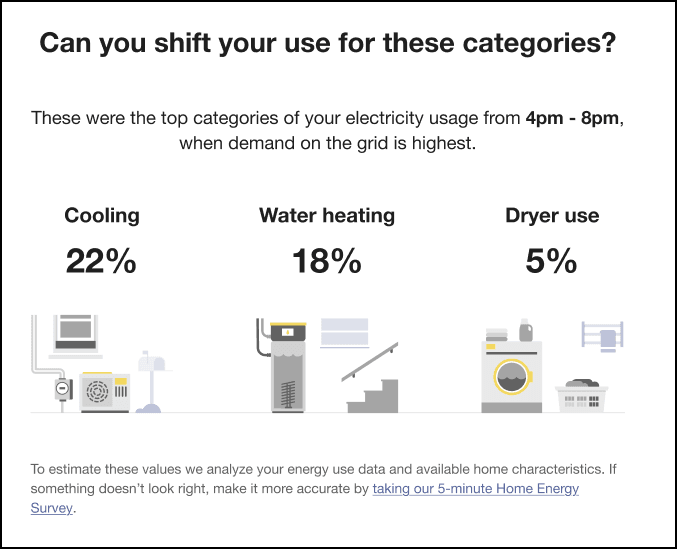
Heading: Displays a question prompting the customer to consider shifting their energy usage during peak periods. For example, “Can you shift your use for these categories?”
Peak Usage Statement: Explains the energy usage for the past week and highlights that the usage occurred during peak grid demand hours. For example, “These were the top categories of your electricity usage from 4pm - 8pm, when demand on the grid is highest.”
End Use Categories: Displays three categories of electricity usage, each including the category name, percentage of usage, and a supporting graphic.
Explainer Statement: Provides context on how the energy usage estimates are calculated and encourages the customer to improve accuracy by taking the Home Energy Survey. For example, “To estimate these values we analyze your energy use data and available home characteristics. If something doesn't look right, make it more accurate by taking our 5-minute Home Energy Survey.”
This is an example of the Flat Rate Disaggregation module:
User Experience Variations
This section discusses the user experience variations in the Flat Rate Post-Bill Disaggregation module.
Cost Variation
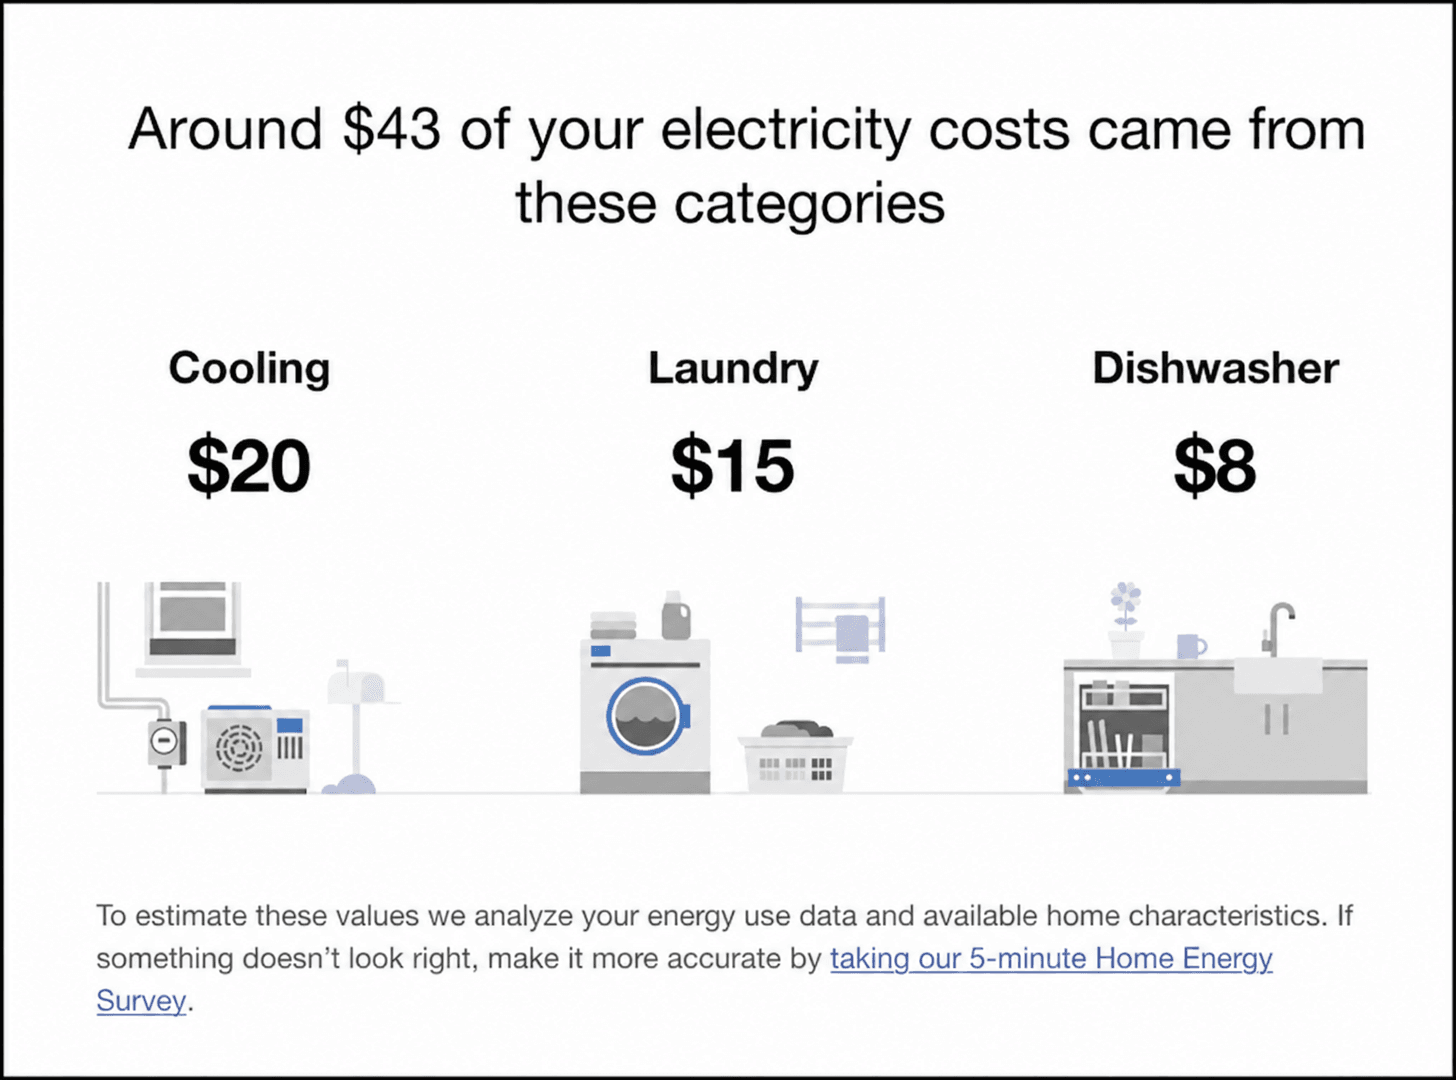
When the module is included in a cost version of the Post-Bill Report email, it varies as follows:
Header: The header tells the user how much money they spent instead of their percentage of usage.
End Use Categories: The cost is displayed instead of the usage percentage.
Post-Bill Variation
When included in the Post-Bill Report email, the module varies as follows:
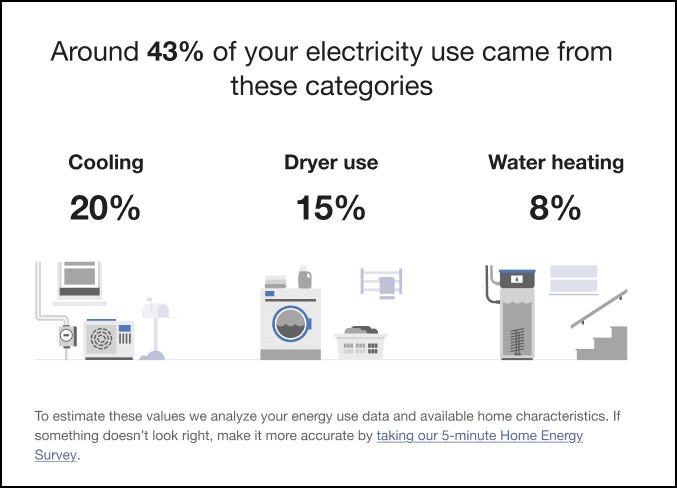
Header: The statement tells the user how much of their energy use came from their top 3 categories.
Peak Usage Statement: This statement is omitted from the module in the Post-Bill Report email.