Hourly Usage Module
This module educates customers about how much electricity they use during peak hours and encourages them to shift tasks to off-peak hours to save money. The module supports partial-peak periods, multiple peak periods in a day.
Requirements and Limitations
This section discusses utility and customer requirements and limitations.
Customer Requirements
| Category | Description |
|---|---|
|
Data Requirements |
AMI (hourly or more granular) data. |
|
Data History |
AMI data for the last 5 or 7 days, depending on whether the utility has peak hours on the weekends. |
|
Data Coverage |
The default requirement is: 50% read coverage for the week covered by the report. Note: This product does not differentiate between estimated and non-estimated reads. Both types of reads are supported. |
Limitations
These are the limitations:
-
Zero Usage: If a customer hasn't used any electricity during the week, several checks are completed to determine whether to hide modules, or to fail the entire email communication. The checks are as follows:
-
Introduction Email: If the Hourly Usage module has 0 usages, exclude that module but send the communication.
- Weekly Email: If the Weekly Comparison module has 0 usages, the communication is not sent. If the Hourly Usage module has 0 usages, the module is excluded from the communication.
- Emails Including the Transition Module: The Weekly Email can contain the Transition module when there is a seasonal rate transition. In cases where the emails include the pre-transition version of the module, if the Weekly Email module has 0 usages, the module is excluded from the communication. If the Hourly Usage module has 0 usages, the module is excluded from the communication.
-
-
Rates with no on-peak period in a given season: The module shows non-peak usage data when no on-peak TOU period is present. See the User Experience Variations.
User Experience
This module includes the following components:
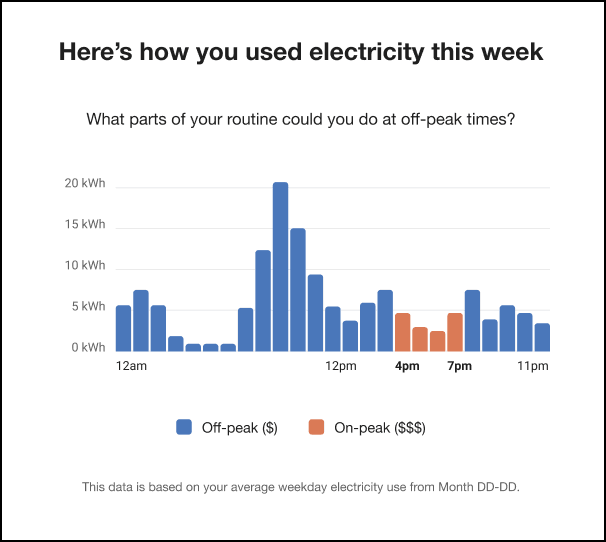
Introduction Statement: This statement directs customers to the graph that depicts how they used energy this week. Below this statement is a question that asks them what parts of their routine they can do during off-peak hours, which encourages them to shift tasks to lower-cost times of the day. For example, "Here's how you used electricity this week".
Hourly Usage Bar Chart: This component shows the customer's average hourly electricity costs during the previous week. The chart highlights peak hours to draw attention to how the customer's average electricity costs during peak hours compare to their average electricity costs during off-peak hours.
Date Range Statement: A statement below the chart identifies the dates used to determine the hourly average usage. For example, "This data is based on your average weekday electricity use from May 12 - 19."
Note:
This module was designed to be used in conjunction with the TOU 101 module.This image shows an example of the Hourly Usage module:
User Experience Variations
This section discusses the user experience variations in the Hourly Usage module.
Partial Peak Periods
For utility companies with partial-peak periods, the module displays off-peak, partial-peak, and peak hours using different colors within the bar chart.
Multiple Peak Periods
For utility companies with multiple peak periods each day, the module displays all peak periods in the chart.
Data Overlapping the Seasonal Transition Date
Costs cannot be calculated for this module if the seasonal transition occurs within the module look back period. The behavior of the module is impacted by whether or not the peak hours data has changed.
Peak hours have changed: If peak hours changed at the season transition, and the look-back period for a given module overlaps the season transition date, then the module fails and the individual module is not included in the TOU Load Shifting Report emails. The report will still be sent with the remaining modules.
Peak hours have not changed: If the customer's peak hours have not changed, one of the following variations occurs:
- If peak hours have not changed in a period that overlaps the seasonal transition, the seasonal transition module is shown in usage form.
-
If peak hours have not changed in a period that overlaps the seasonal transition, and non-peak data for other data changing modules in the report have changed during the season transition date, then all of the report modules are shown in usage form. Costs are not calculated or shown.