Design and Configuration: Weekly Engagement Reports
This section discusses the design, configuration options, and the user experience variations that are specific to the Weekly Engagement Report emails. Weekly Engagement Report types include:
- Weekly Emails
- Post-Bill Report Emails
- Cost Tracker Emails
- Cost Tracker Post-Bill Report Emails
The following report types are supported:
- Single Fuel Electric: For customers who only have electricity, the energy units are displayed as kilowatt-hours (kWh).
- Single Fuel Natural Gas: For customers who only have natural gas, the energy units are displayed as therms, CCF, or m3.
- Dual Fuel - Electric and Natural Gas: For customers who have both electricity and natural gas, electric use is displayed as kWh and gas use is displayed as therms, CCF, or m3.
Global Configurations
The following global configurations impact multiple modules that are used in the Weekly Engagement Reports. For each element listed in the table, indicate the desired configuration in the Input Value column. If you do not provide an input for optional configurations, the default will be used.
| Configuration Option | Input Value |
|---|---|
|
Show Energy Use in Place of Energy Costs Energy use can be displayed rather than energy costs even in the scenario where cost information is available. Default: Display energy costs when available. |
Optional Choose one of the following:
|
|
Enable Negative Energy Use Display For customers on net metering rate plans that support solar credits, negative energy use can be displayed in applicable graphs such as the Weekly Comparison Module and the Day by Day and Hourly Breakdown Module. Default: Disable display of negative energy use or energy costs. |
Optional Choose one of the following:
|
Weekly Reports
Weekly Engagement Report emails are the original, and most common email reports sent to customers every week. These emails inform customers of their energy usage patterns, trends, and projected energy usage or costs. With these emails, customers can better understand how their actions correspond to their utility bills, get a preview of their use or bill, and get helpful insights on how to adjust their energy use.
The emails are made up of individual modules. The following list includes the recommended modules, in the recommended order:
- Email Header Module and Subject Lines
- Introduction Module
- Weekly Comparison Module
- Bill Forecast Module
- Day by Day and Hourly Breakdown Module
- Tips Module
- Easy Open Module (Optional)
- Customer Feedback Module (Optional. Included in the Energy Efficiency Cloud Service.)
- Email Footer Module
You can also include EV Load shifting insights in your email. For information about these insights, see EV Load Shifting Insights in Weekly Engagement Report Emails.
The image below shows an example of an electricity Weekly Engagement Report email.

Post-Bill Report Emails
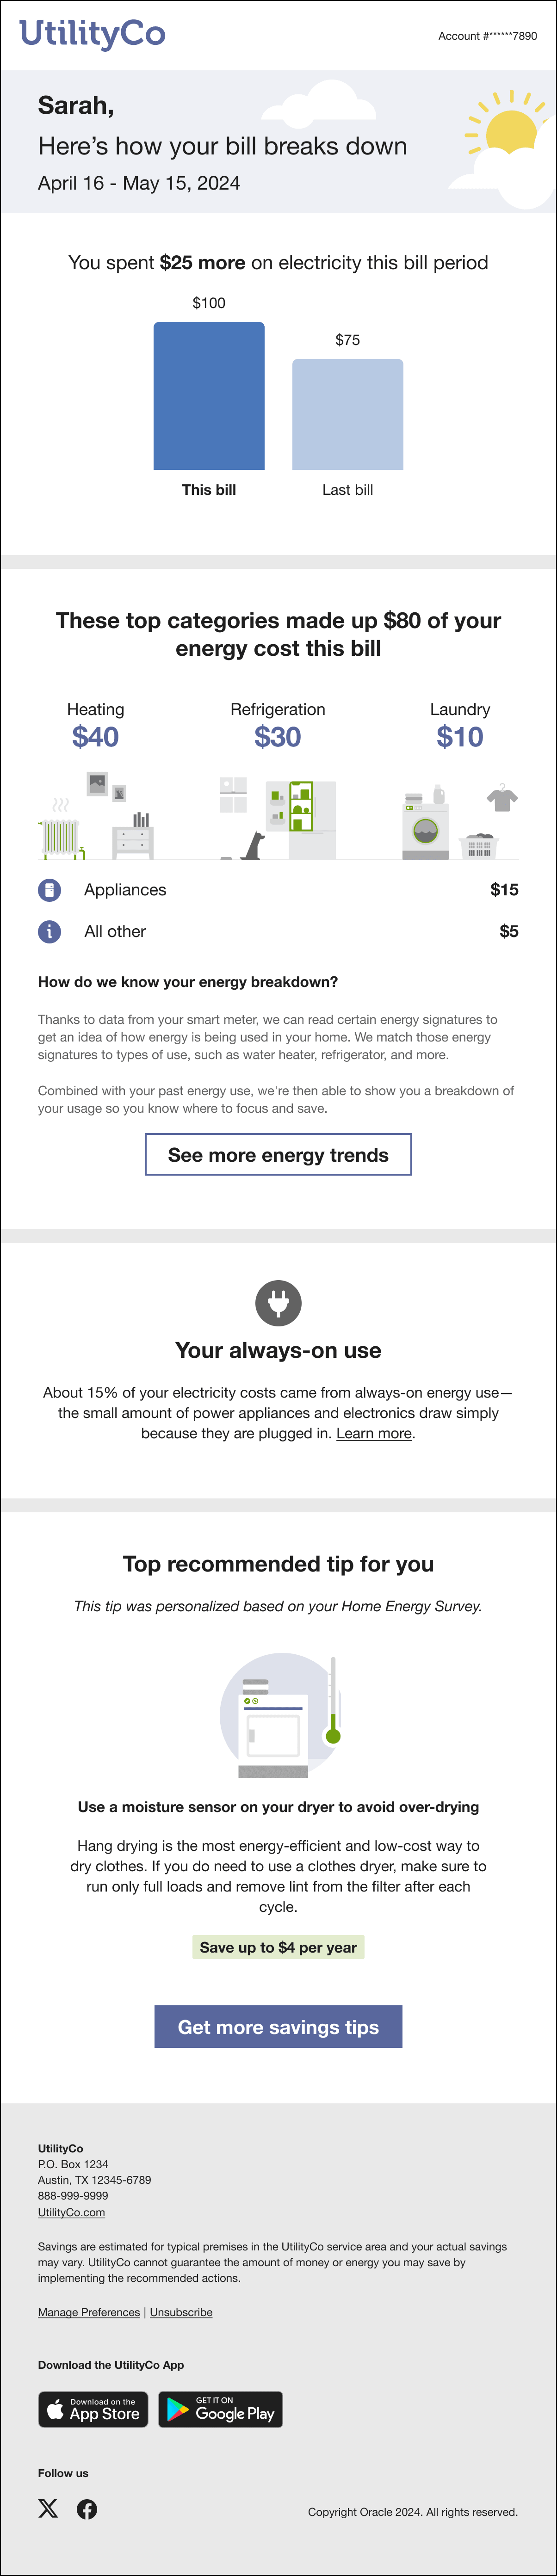
After a bill period is completed, customers can receive the Post-Bill Report email, which provides deeper understanding of how much energy each of their major gas or electric end uses consumed during the month. Disaggregated cost or usage is based on the AMI data that is collected during the billing period. Providing this information helps customers understand where they are using the most energy, and provides them with suggestions about how they can reduce use and save money.
The Post-Bill Report email uses the information that the utility knows about the customer to determine their energy usage. While Opower's Appliance Detection and Disaggregation models are not required, they can enhance the data that is provided in the Post-Bill Report email. Your Delivery Team can provide you with additional details regarding appliance disaggregation.
Customers receive one Post-Bill Report email each month. This email replaces the standard weekly email on the week after the customer's bill period ends.
The Post-Bill Report email is made up of individual modules, and it is recommended that they are included in the email in the following order:
- Email Header Module and Subject Lines
- Post-Bill Report Introduction Module
- Post-Bill Report Bill Comparison Module
- Post-Bill End Uses Module
- Post-Bill Always On Module
- Tips Module
- Easy Open Module (Optional)
- Customer Feedback Module (Optional. Included in the Energy Efficiency Cloud Service.)
- Email Footer Module
You can also include EV Load shifting insights in your Post-Bill Report emails. For information about these insights, see EV Load Shifting Insights in Weekly Engagement Report Emails.
Cost Tracker Emails
Cost Tracker emails are designed to help residential customers save more energy by showing them how their energy costs are tracking across the month.
Cost Tracker emails are made up of individual modules. The following list includes the recommended modules, in the recommended order:
- Email Header Module and Subject Lines
- Introduction Module
- Cost Tracker Module
- Day by Day and Hourly Breakdown Module
- Tips Module
- Easy Open Module (Optional)
- Customer Feedback Module (Optional. Included in the Energy Efficiency Cloud Service.)
- Email Footer Module
The image below shows an example of an electricity Cost Tracker Report email.

Cost Tracker Post-Bill Report
After a bill period is completed, customers who are receiving the Cost Tracker Emails can receive the Cost Tracker Post-Bill Report email, which provides deeper understanding of how much energy each of their major gas or electric end uses consumed during the month. Disaggregated cost or usage is based on the AMI data that is collected during the billing period. Providing this information helps customers understand where they are using the most energy, and provides them with suggestions about how they can reduce use and save money.
The Cost Tracker Post-Bill Report email uses the information that the utility knows about the customer to determine their energy usage. While Opower's Appliance Detection and Disaggregation models are not required, they can enhance the data that is provided in the Cost Tracker Post-Bill Report email. Your Delivery Team can provide you with additional details regarding appliance disaggregation.
Customers receive one Post-Bill Report email each month. This email replaces the standard weekly email on the week after the customer's bill period ends.
The Post-Bill Report email for customers who receive Cost Tracker Report emails is made up of individual modules, and it is recommended that they are included in the email in the following order:
- Email Header Module and Subject Lines
- Post-Bill Report Introduction Module
- Cost Tracker Module
- Post-Bill End Uses Module
- Post-Bill Always On Module
- Tips Module
- Easy Open Module (Optional)
- Customer Feedback Module (Optional. Included in the Energy Efficiency Cloud Service.)
- Email Footer Module
This image shows an example of the email:
