4 Troubleshoot Performance Issues Using Flight Recorder
To learn more about creating a recording with Flight Recorder in Java Mission Control (JMC), see Start a Flight Recording.
The data provided by Flight Recorder helps you investigate performance issues. No other tool gives as much profiling data without skewing the results with its own performance overhead. This chapter provides information about performance issues that you can identify and debug using data from Flight Recorder.
This chapter contains the following sections:
Flight Recorder Overhead
When you measure performance, it is important to consider any performance overhead added by Flight Recorder. The overhead will differ depending on the application. If you have any performance tests set up, you can measure if there is any noticeable overhead on your application.
The overhead for recording a standard time fixed recording (profiling recording) using the default settings is less than two percent for most applications. Running with a standard continuous recording generally has no measurable performance effect.
Using Heap Statistics, which is disabled by default, can cause significant performance overhead. This is because enabling Heap Statistics triggers an old garbage collection at the beginning and the at end of the test run. These old GCs give some extra pause times to the application, so if you are measuring latency or if your environment is sensitive to pause times, do not run with Heap Statistics enabled. The Heap Statistics feature is useful when debugging memory leaks or when investigating the live set of the application. For more information, see The jfr tool.
Note:
For performance profiling use cases, heap statistics may not be necessary.Find Bottlenecks
Different applications have different bottlenecks. Waiting for I/O or networking, synchronization between threads, CPU usage or garbage collection times can cause bottlenecks in an application. It is possible that an application has more than one bottleneck.
Use JDK Mission Control to Find Bottlenecks
You can use JMC to find application bottlenecks.
One way to find out the application bottlenecks is to analyze the Automated Analysis Results page. This page provides comprehensive automatic analysis of flight recording data.
- A graph that plots live thread usage by the application over time.
- A table with all live threads used by the application.
- Stack traces for selected threads.
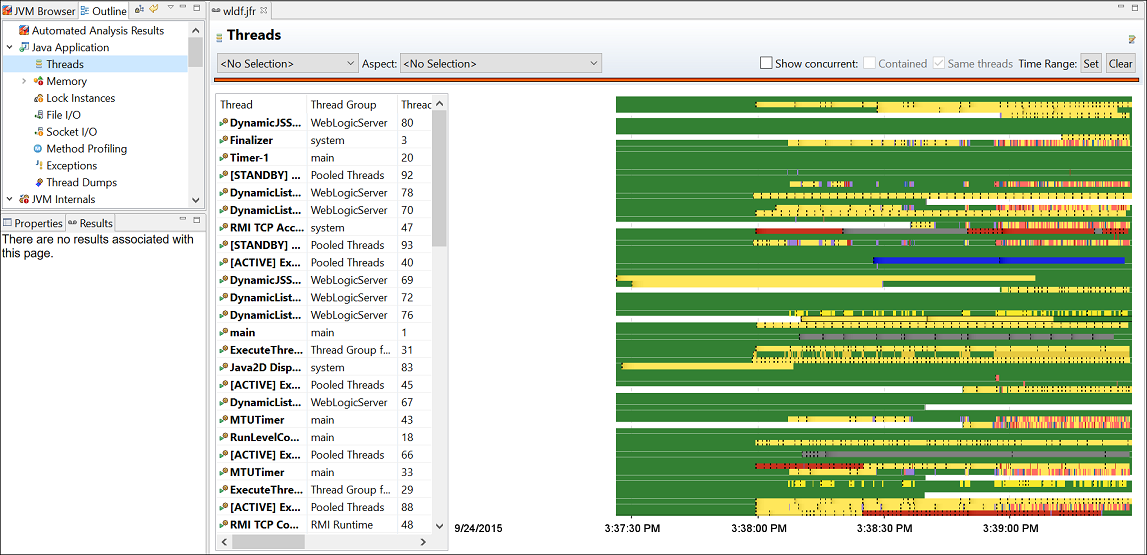
Here is a sample figure of a recording, which shows a graph with thread details.
In the graph, each row is a thread, and each thread can have several lines. In the figure, each thread has a line, which represents the Java Application events that were enabled for this recording. The selected Java Application events all have the important property that they are all thread-stalling events. Thread stalling indicates that the thread was not running your application during the event, and they are all duration events. The duration event measures the duration the application was not running.
In the graph, each color represents a different type of event. For example:
- Yellow represents Java Monitor Wait events. The yellow part is when threads are waiting for an object. This often means that the thread is idle, perhaps waiting for a task.
- Salmon represents the Java Monitor Blocked events or synchronization events. If your Java application's important threads spend a lot of time being blocked, then that means that a critical section of the application is single threaded, which is a bottleneck.
- Red represents the Socket Reads and Socket Writes events. Again, if the Java application spends a lot of time waiting for sockets, then the main bottleneck may be in the network or with the other machines that the application communicates.
- Green represents parts that don't have any events. This part means that the thread is not sleeping, waiting, reading to or from a socket, or not being blocked. In general, this is where the application code is run. If your Java application's important threads are spending a lot of time without generating any application events, then the bottleneck in the application is the time spent executing code or the CPU itself.
Note:
For most Java Application event types, only events longer than 20 ms are recorded. (This threshold can be modified when starting the flight recording.) The areas may not have recorded events because the application is doing a lot of short tasks, such as writing to a file (a small part at a time) or spending time in synchronization for very short amounts of time.The Automated Analysis Results page also shows information about garbage collections. To see if garbage collections may be a bottleneck, see the next topic about garbage collection performance.
Use the jfr Tool to Find Bottlenecks
Different applications have different bottlenecks. For some applications, a bottleneck may be waiting for I/O or networking, it may be synchronization between threads, or it may be actual CPU usage. For others, a bottleneck may be garbage collection times. It is possible that an application has more than one bottleneck.
One way to find the application bottlenecks is to look at the following events in your flight recording. Make sure that all of these events are enabled in the recording template that you are using:
-
jdk.FileRead jdk.FileWritejdk.SocketReadjdk.SocketWritejdk.JavaErrorThrowjdk.JavaExceptionThrowjdk.JavaMonitorEnterjdk.JavaMonitorWaitjdk.ThreadStartjdk.ThreadEndjdk.ThreadSleepjdk.ThreadPark
The selected Java Application events all have the important property that they are all thread-stalling events. Thread stalling indicates that the thread was not running your application during the event, and they are all duration events. The duration event measures the duration the application was not running.
Use the jfr tool to print the events that were recorded and look for the following information:
jdk.JavaMonitorWaitevents show how much time a thread spends waiting for a monitor.jdk.ThreadSleepandjdk.ThreadParkevents show when a thread is sleeping or parked.- Read and write events show how much time is spent in I/O.
If your Java application's important threads spend a lot of time being blocked, then that means that a critical section of the application is single threaded, which is a bottleneck. If the Java application spends a lot of time waiting for sockets, then the main bottleneck may be in the network or with the other machines that the application communicates with. If your Java application's important threads are spending a lot of time without generating any application events, then the bottleneck in the application is the time spent executing code or the CPU itself. Each of these bottlenecks can be further investigated within the flight recording.
Note:
For most Java Application event types, only events longer than 20 ms are recorded. (This threshold can be modified when starting the flight recording.) To summarize, the areas may not have recorded events because the application is doing a lot of short tasks, such as writing to a file (a small part at a time) or spending time in synchronization for very short amounts of time.Garbage Collection Performance
Flight recordings can help you diagnose garbage collection issues in Java application.
Use JDK Mission Control to Debug Garbage Collection Issues
You can use JMC to debug garbage collections (GC) issues.
Tuning the HotSpot Garbage Collector can have a big effect on performance. See Garbage Collection Tuning Guide for general information.
Take a profiling flight recording of your running application. Do not include the heap statistics, as that will trigger additional old garbage collections. To get a good sample, take a longer recording, for example one hour.
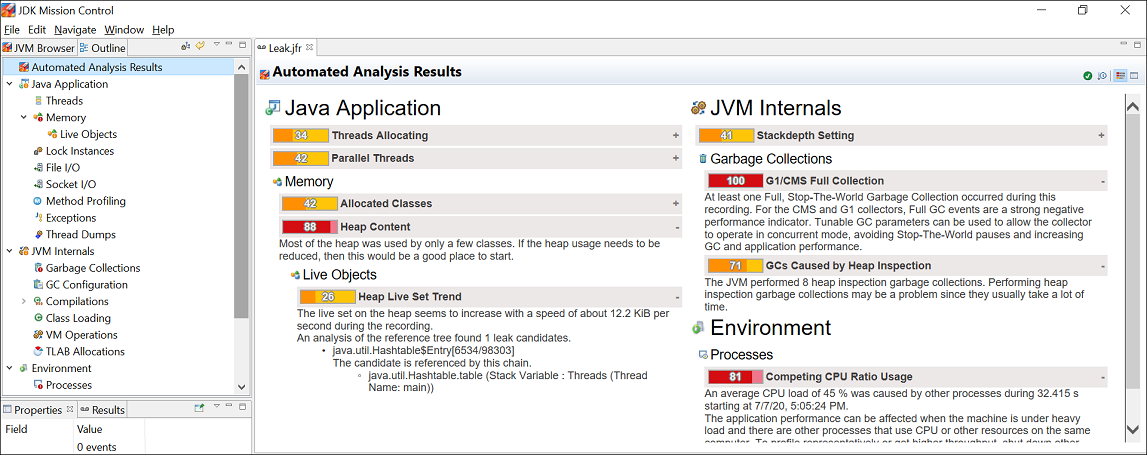
Open the recording in JMC. Look at the Garbage Collections section in the Automated Analysis Results page. Here is a sample figure of a recording, which provides a snapshot of garbage collection performance during runtime.
Figure 4-2 Automated Analysis Results - Garbage Collections
Description of "Figure 4-2 Automated Analysis Results - Garbage Collections "
You can observe from the figure that there is a Full GC event. This is indicative of the fact that application needs more memory than what you have allocated.
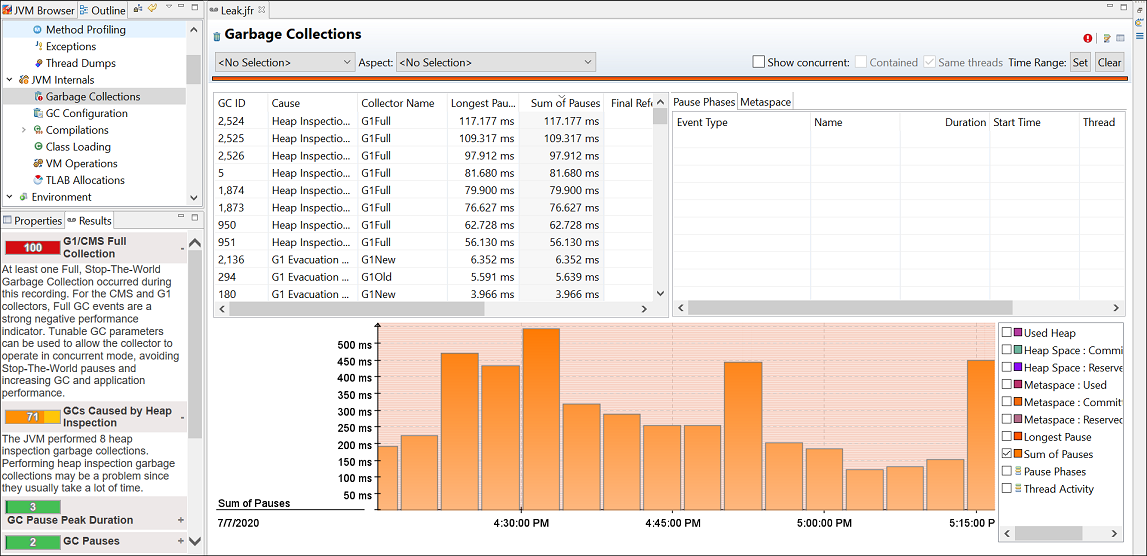
For further analysis, open the Garbage Collections page under the JVM Internals page to investigate the overall performance impact of the GC. Here is a sample figure of a recording, which shows a graph with GC pauses.
Figure 4-3 Garbage Collection Performance - GC Pauses
Description of "Figure 4-3 Garbage Collection Performance - GC Pauses"
From the graph look at the Sum of Pauses from the recording. The Sum of Pauses is the total amount of time that the application was paused during a GC. Many GCs do most of their work in the background. In those cases, the length of the GC does not matter and what matters is how long the application actually had to stop. Therefore, the Sum of Pauses is a good measure for the GC effect.
The main performance problems with garbage collections are usually either that individual GCs take too long, or that too much time is spent in paused GCs (total GC pauses).
When an individual GC takes too long, you may need to change the GC strategy. Different GCs have different trade-offs when it comes to pause times verses throughput performance. See Behavior-Based Tuning in Java Platform, Standard Edition HotSpot Virtual Machine Garbage Collection Tuning Guide.
In addition, you may also need to fix your application so that it makes less use of finalizers or semireferences. See Monitoring the Objects Pending Finalization and Finalization and Weak, Soft, and Phantom References in Java Platform, Standard Edition HotSpot Virtual Machine Garbage Collection Tuning Guide for information about detecting and migrating from finalization.
If the application spends too much time paused, you can look into different ways to overcome this. One way is to increase the Java heap size. Look at the GC Configuration page to estimate the heap size used by the application, and change the initial heap size and maximum heap size to a higher value. The bigger the heap, the longer time it is between GCs. Watch out for any memory leaks in the Java application, because that may cause more frequent GCs until an OutOfMemoryError is thrown. For more information, see The jfr tool. Another way to reduce the GC cycles is to allocate fewer temporary objects. In the TLAB Allocations page, look at how much memory is allocated over the course of the recording. Small objects are allocated in a Thread Local Area Buffer (TLAB). TLAB is a small memory area where new objects are allocated. Once a TLAB is full, the thread gets a new one. Larger objects are allocated outside a TLAB. Often, the majority of allocations happen inside a TLAB. Lastly, to reduce the need of GCs, decrease the allocation rate. Select the TLAB Allocations page and then look at the allocation sites that have the most memory pressure. You can either view it per class or thread to see which one consumes the most allocation.
Some other settings may also increase GC performance of the Java application. See Garbage Collection Tuning Guide in Java Platform, Standard Edition HotSpot Virtual Machine Garbage Collection Tuning Guide for more information about GC performance.
Use the jfr Tool to Debug Garbage Collection Issues
Recordings from Flight Recorder can help diagnose Java application issues with garbage collections.
Tuning the HotSpot Garbage Collector can have a big effect on performance. See Introduction to Garbage Collection Tuning in Java Platform, Standard Edition HotSpot Virtual Machine Garbage Collection Tuning Guide for more information.
To investigate garbage collection issues, take a profiling flight recording of your application while it is running. Do not include the heap statistics, because that triggers extra old collections. To get a good sample, take a longer recording, for example, 1 hour.
Use the jfr tool to print the jdk.GCPhasePause events that were recorded. The following example shows the information contained in the event:
c:\Program Files\Java\jdk-15\bin>jfr print --events jdk.GCPhasePause \
   gctest.jfr
jdk.GCPhasePause {
  startTime = 11:19:13.779
  duration = 3.419 ms
  gcId = 1
  name = "GC Pause"
  eventThread = "VM Thread" (osThreadId = 17528)
}
Using the information from the jdk.GCPhasePause events, you can calculate the average sum of pauses for each GC, the maximum sum of pauses, and the total pause time. The sum of pauses is the total amount of time that the application was paused during a GC. Many GCs do most of their work in the background. In those cases, the length of the GC does not matter and what matters is how long the application actually had to stop. Therefore, the sum of pauses is a good measure for the GC effect.
The main performance problems with garbage collections are usually either that individual GCs take too long, or that too much time is spent in paused GCs (total GC pauses).
When an individual GC takes too long, you may need to change the GC strategy. Different GCs have different trade-offs when it comes to pause times versus throughput performance. See Behavior-Based Tuning in Java Platform, Standard Edition HotSpot Virtual Machine Garbage Collection Tuning Guide.
In addition, you may also need to fix your application so that it makes less use of finalizers or semireferences. See Monitoring the Objects Pending Finalization and Finalization and Weak, Soft, and Phantom References in Java Platform, Standard Edition HotSpot Virtual Machine Garbage Collection Tuning Guide for information about detecting and migrating from finalization.
When the application spends too much time paused, there are different ways to work around that:
-
Increase the Java heap size. The bigger the Java heap, the longer time it is between GCs. Watch out for any memory leaks in the Java application, because that may cause more and more frequent GCs until an
OutOfMemoryErroris thrown. For more information, see The jfr tool. -
To reduce the number of GCs, allocate fewer temporary objects. Small objects are allocated in a Thread Local Area Buffer (TLAB). TLAB is a small memory area where new objects are allocated. Once a TLAB is full, the thread gets a new one. Larger objects are allocated outside a TLAB. Often, the majority of allocations happen inside a TLAB. The
jdk.ObjectAllocationInNewTLABandjdk.ObjectAllocationOutsideTLABevents provide information about the allocation of temporary objects. -
To reduce the need of GCs, decrease the allocation rate. The
jdk.ThreadAllocationStatisticsevent provides information about the allocations per thread.
Some other settings may also increase GC performance of the Java application. See Garbage-First Garbage Collection in Java Platform, Standard Edition HotSpot Virtual Machine Garbage Collection Tuning Guide for more information about GC performance.
Synchronization Performance
Java applications encounter synchronization issues when the application threads spend a lot of time waiting to enter a monitor.
Use JDK Mission Control to Debug Synchronization Issues
You can use JMC to debug Java Application synchronization issues.
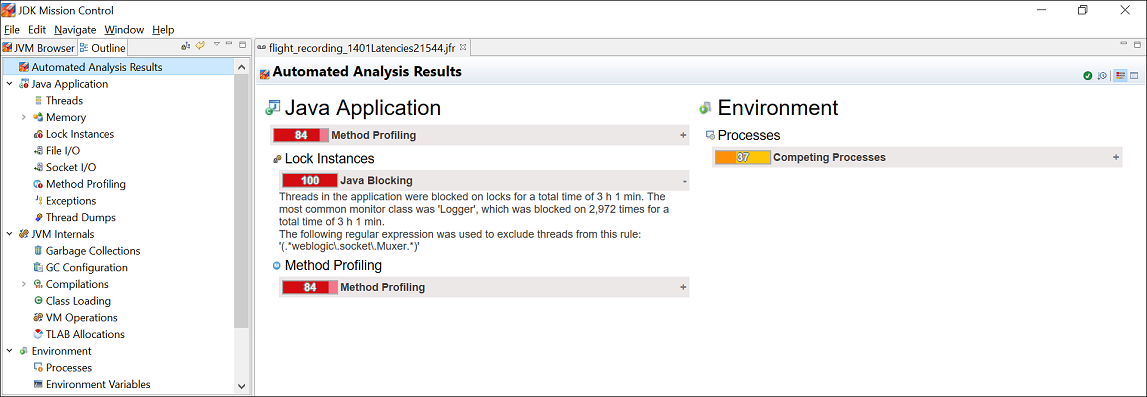
Open the flight recording in JMC and look at the Automated Analysis Results page. Here is a sample figure of a recording, which shows threads that are blocked on locks.
Figure 4-4 Synchronization Issue - Automated Analysis Results Page
Description of "Figure 4-4 Synchronization Issue - Automated Analysis Results Page"
Focus on the Lock Instances section of the page, which is highlighted in red. This is indicative of a potential problem. You can observe that there are threads that are blocked on locks.
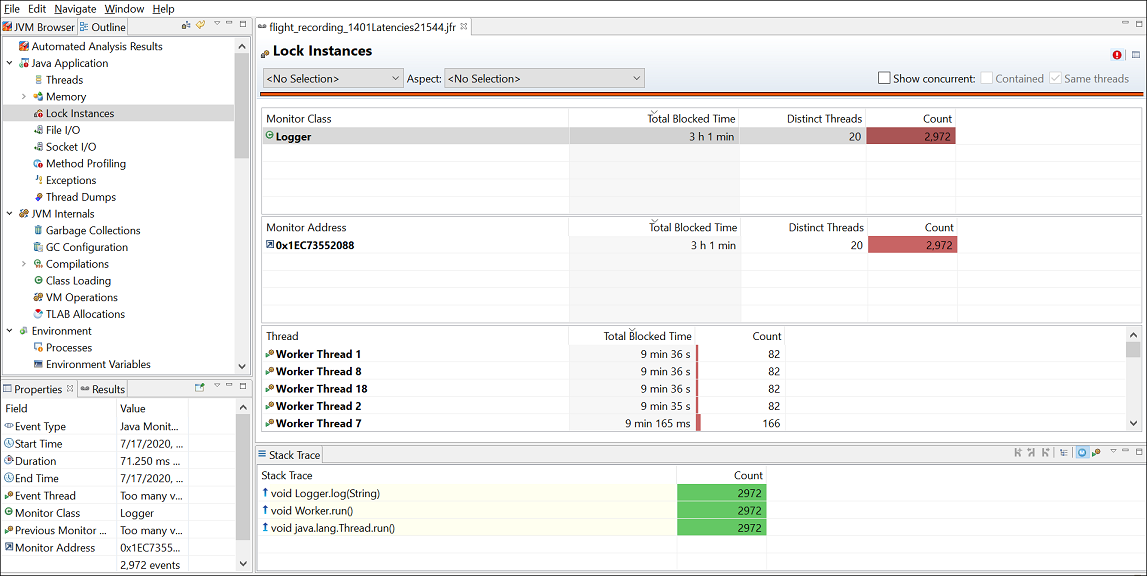
For further analysis, open the Lock Instances page. Here is a sample figure of a recording, which shows the thread that is blocked on locks the most and the stack trace of the thread waiting to acquire the lock.
Figure 4-5 Synchronization Issue - Lock Instance
Description of "Figure 4-5 Synchronization Issue - Lock Instance"
You can notice that threads in the application were blocked on locks for a total time of 3 hours. The most common monitor class in contention was Logger, which was blocked 2972 times.
Typically, logging is an area that can be a bottleneck in applications. In this scenario, the blocking events all seem to be due to calls to the log method. You can review and make required code changes to fix this issue.
Use jdk.JavaMonitorWait Events to Debug Synchronization Issues
To debug Java Application synchronization issues, which is where the application threads spend a lot of time waiting to enter a monitor, look at the jdk.JavaMonitorWait events in a recording from Flight Recorder.
Look at the locks that are contended the most and the stack trace of the threads waiting to acquire the lock. Typically, look for contention that you did not think would be an issue. Logging is a common area that can be an unexpected bottleneck in some applications.
When you see performance degradation after a program update or at any specific times in the Java application, take a flight recording when things are good, and take another one when things are bad to look for a synchronization site that increases a lot.
Note:
By default, contention events with a duration longer than 20 ms are recorded. This threshold can be modified when starting the flight recording. Shorter thresholds give more events and also potentially more overhead. If you believe contention is an issue, then you could take a shorter recording with a very low threshold of only a few milliseconds. When this is done on a live application, make sure to start with a very short recording, and monitor the performance overhead.I/O Performance
Flight recordings can help you diagnose I/O performance issues in Java application.
Use JDK Mission Control to Debug I/O Issues
You can diagnose I/O issues in an application by monitoring the Socket I/O or the File I/O pages in JMC.
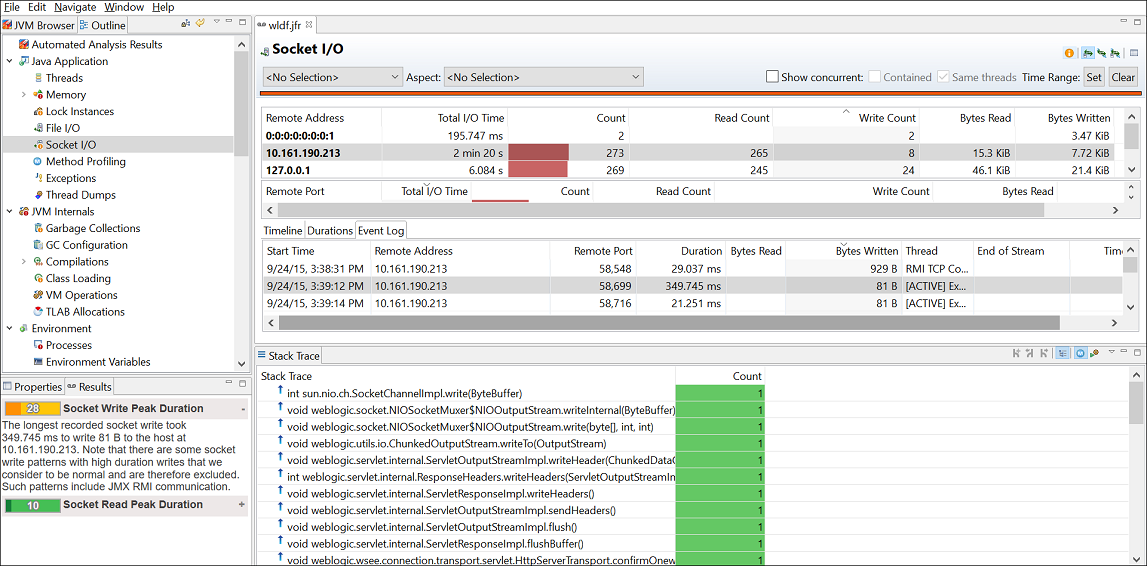
When a Java application spends a lot of time either in Socket Read, Socket Write, File Read, or File Write, then I/O or networking can cause bottleneck. To diagnose I/O issues in applications, open the Socket I/O page under the Java Application page in the Automated Analysis Results page. Here is a sample figure of a recording, which shows Socket I/O details.
The figure shows that for the application the longest recorded socket write took 349.745 ms to write 81 B to the host.
File or networking I/O issues are diagnosed in a similar fashion. Look at the files read from or written to the most, then see each file read/write and the time spent on I/O.
By default, the Socket I/O page lists events with a duration longer than 10 ms. When starting a flight recording, you can lower the file I/O Threshold or socket I/O Threshold to gather more data, but this could potentially have a higher performance overhead.
Use the Socket Read and Write Events to Debug I/O Issues
When a Java application spends a lot of time reading or writing sockets or files, then I/O or networking may be the bottleneck. Recordings from Flight Recorder can help identify problem areas.
To diagnose I/O issues in applications, look at the following events in your flight recording. Make sure that all of these events are enabled in the recording template that you are using:
jdk.SocketWritejdk.SocketReadjdk.FileWritejdk.FileRead
Use the socket read and write information in your flight recording to calculate the number of reads from a specific remote address, the total number of bytes read, and the total time spent waiting. Look at each event to analyze the time spent and data read.
File or networking I/O issues are diagnosed in a similar fashion. Look at the files read to or written to the most, then see each file read/write and the time spent on I/O.
By default, only events with a duration longer than 20 ms are recorded. When starting a flight recording, you can lower the file I/O threshold or the socket I/O threshold to gather more data, potentially with a higher performance effect.
Code Execution Performance
Flight recordings can help you diagnose code execution performance issues in Java application.
Use JDK Mission Control to Monitor Code Execution Performance
You can use JMC to monitor the code execution performance.
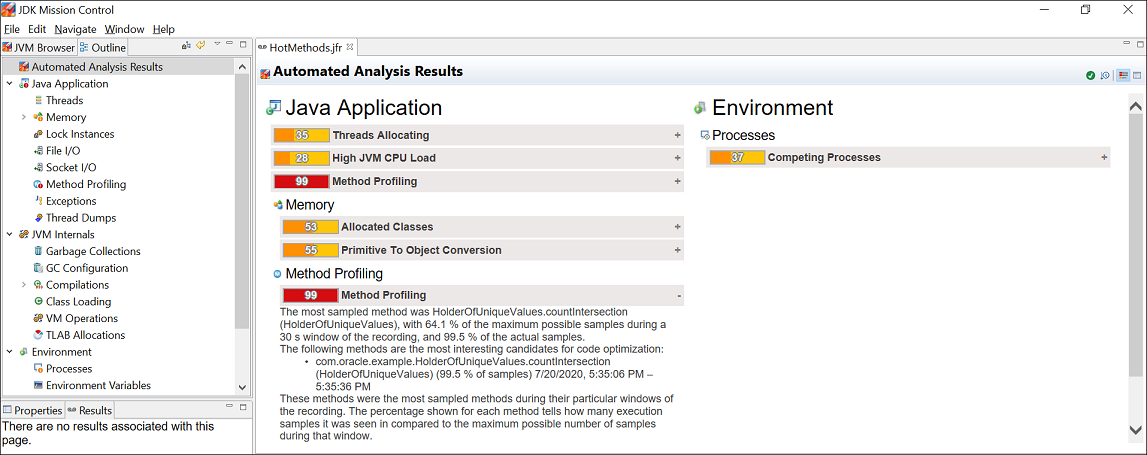
When there are not a lot of Java Application events, it could be that the main bottleneck of your application is the running code. In such scenarios, look at the Method Profiling section of the Automated Analysis Results page. Here is a sample figure of a recording, which indicates that there is value in optimizing certain methods.
Figure 4-7 Code Execution Performance - Automated Analysis Results Page
Description of "Figure 4-7 Code Execution Performance - Automated Analysis Results Page"
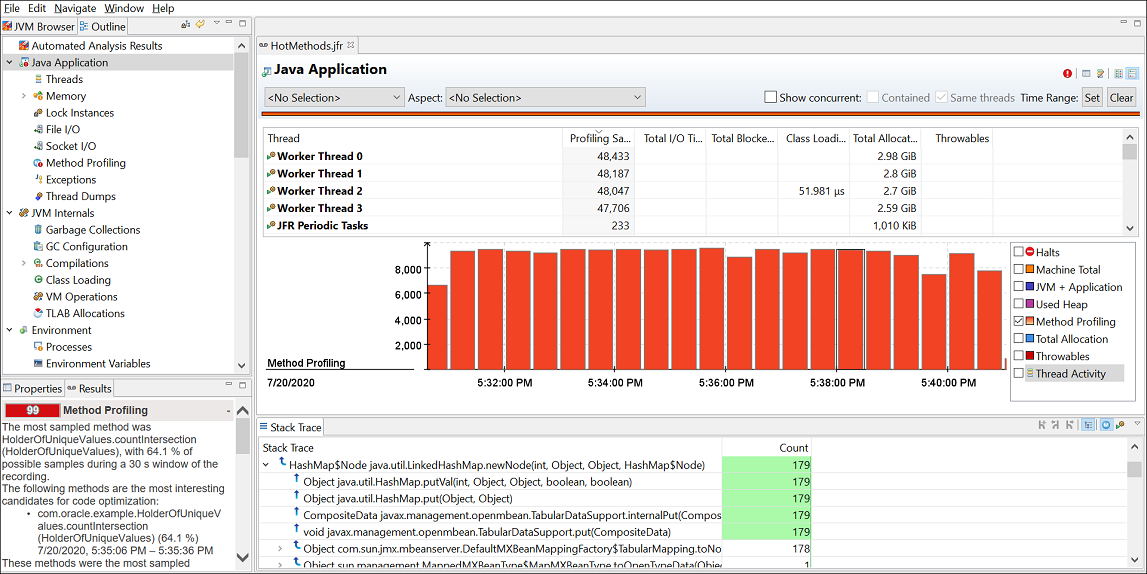
Now, open the Java Application page. Here is a sample figure of a recording, which shows the Method Profiling graph and the stack traces.
Figure 4-8 Code Execution Performance - Java Application
Description of "Figure 4-8 Code Execution Performance - Java Application"
You can observe that the stack trace view shows the aggregated stack traces of any selection in the editor and also the stack traces for the profiling samples. In the figure, you can notice that one of these methods has a lot more samples than the others. This means that the JVM has spent more time executing that method relative to the other methods.
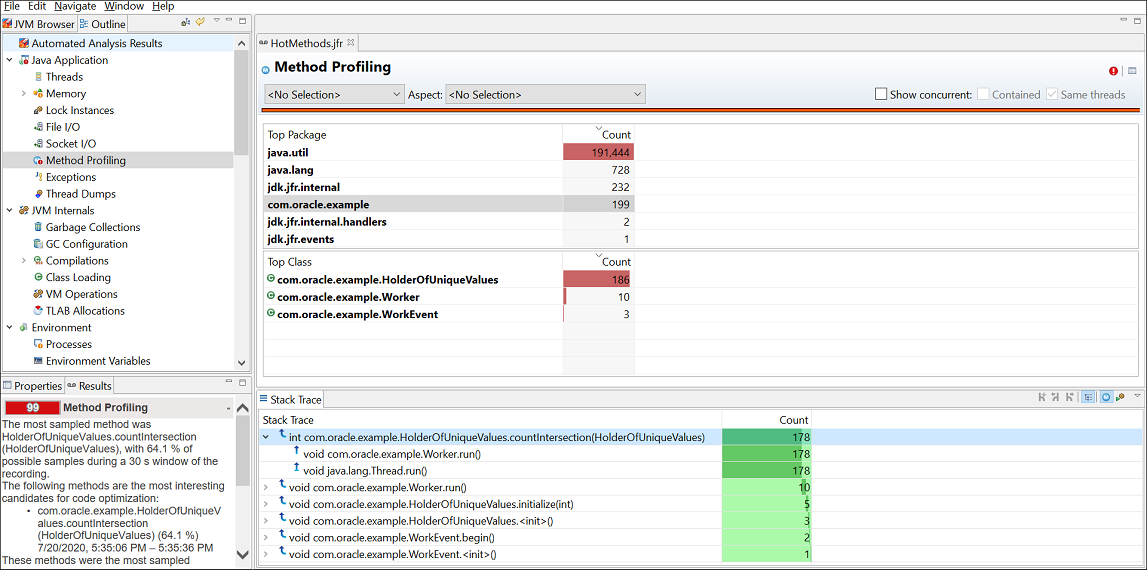
To identify which method would be the one to optimize to improve the performance of the application, open the Method Profiling page. Here is a sample figure of a recording, which shows the method that needs to be optimized.
Figure 4-9 Code Execution Performance - Method Profiling
Description of "Figure 4-9 Code Execution Performance - Method Profiling"
As you can observe, in the stack trace view, the most sampled method was HolderOfUniqueValues.countIntersection(). You can review and make required code changes to optimize this method to effectively improve the performance of the application.
Use jdk.CPULoad and jdk.ThreadCPULoad Events to Monitor Code Execution Performance
When there are not a lot of Java Application events, it could be that the main bottleneck of your application is the running code. Recordings from Flight Recorder can help identify problem areas.
Look at the jdk.CPULoad events and review the CPU usage over time. This shows the CPU usage of the JVM being recorded and the total CPU usage on the machine. If the JVM CPU usage is low, but the CPU usage of the machine is high, then some other application is likely taking a lot of CPU. In that case, look at the other applications running on the system using OS tools such as Top or the task manager to find out which processes are using a lot of CPU.
In case your application is using a lot of CPU time, look at jdk.ThreadCPULoad events and identify the threads that use the most CPU time. This information is based on method sampling, so it may not be 100% accurate if the sample count is low. When a recording is running, the JVM samples the threads. By default, a continuous recording does only some method sampling, while a profiling recording does as much as possible. The method sampling gathers data from only those threads running code. The threads waiting for I/O, sleeping, waiting for locks, and so on are not sampled. Therefore, threads with a lot of method samples are the ones using the most CPU time; however, how much CPU is used by each thread is not known.
The Hot Methods tab in the Code tab group helps find out where your application spends most of the execution time. This tab shows all the samples grouped by top method in the stack. Use the Call Tree tab to start with the lowest method in the stack traces and then move upward. starts with Thread.run, and then looks at the calls that have been most sampled.
