Introduction
EBS Observability Overview
This solution playbook provides a comprehensive guide for monitoring and diagnostics of key EBS components, including Concurrent Manager, WebLogic, EBS Forms, Workflow Manager, and databases. We will also demonstrate how to aggregate data from multiple OCI Observability and Management (O&M) services into a custom dashboard and configure drilldowns from OCI Application Performance Monitoring (APM) to OCI Database Management (DBM), OCI Log Analytics, and OCI Ops Insights.
Observability and Management offers a holistic solution by uniting application performance, database performance, log analysis, stack monitoring, and capacity planning. These services are interconnected through cross-service dashboards and defined drilldowns, enabling seamless navigation between services for deeper insights.

OCI Application Performance Monitoring
OCI Application Performance Monitoring (APM) provides end-to-end visibility into application performance using OpenTelemetry standards. It collects trace data from EBS, allowing users to:
- View calls made by the application
- Understand the user experience
- Triage errors and latency
- Test application availability

OCI Stack Monitoring
OCI Stack Monitoring provides full-stack visibility into the health and performance of an EBS eviornment. It enables proactive monitoring and management by collecting key metrics, allowing users to:
- Monitor the availability and performance of Concurrent Manager, WebLogic, EBS Forms, Workflow Manager, and databases
- Gain insights into resource utilization and dependencies
- Detect anomalies and troubleshoot issues proactively
- Create custom metrics on any resource type

OCI Log Analytics
OCI Log Analytics (LA) provides powerful exploration and analysis capabilities, enabling users to efficiently monitor and troubleshoot EBS logs. It ingests, indexes, and analyzes logs from WebLogic and various EBS components, helping users:
- Detect patterns and anomalies in log data
- Correlate logs across multiple services for faster troubleshooting
- Perform advanced searches and visualizations using a rich query language
- Set up alerts and automated responses based on log insights

OCI Database Management
OCI Database Management (DBM) simplifies the management of databases through a unified interface. Its offers comprehensive views of database activity and performance, including:
- SQL and user session performance
- Execution statistics
- Blocking sessions
- Historical SQL monitoring reports

OCI Ops Insights
OCI Operations Insights (Ops Insights) provides deep visibility into resource utilization and capacity planning across Oracle Cloud Infrastructure and on-premises environments. It leverages machine learning to analyze historical performance data, helping users:
- Analyze historical SQL
- Monitor database and infrastructure resource consumption
- Predict future capacity needs

Benefits of EBS Observability
- End-to-end monitoring for EBS components such as Concurrent Manager, WebLogic, EBS Forms, Workflow Manager, and databases.
- Correlated logs, metrics, traces, and SQL performance for faster root cause analysis.
- Visibility into requests, transactions, and events to identify application and database bottlenecks.
- AI-driven log anomaly detection with real-time alerts, allowing proactive resolution of potential failures before they escalate.
Prerequisites
- A working EBS environment
Implementation Steps
Task 1: Setting Up APM
To begin using APM, follow these steps to create an APM domain and install the Java agent on your EBS environment
- Create an APM Domain
Refer to the APM Documentation on how to create an APM Domain. - Install the APM Java Agent on EBS
Follow the OCI guide for configuring APM for E-Business Suite to install the Java agent and start monitoring your EBS environment. - Set up Real User Experience Insight (RUEI)
Follow the OCI guide on setting up RUEI for EBS to monitor Froms sessions. - Enable Availability Monitors
Follow the OCI documentation of Availability Monitoring to proactively monitor your EBS environments.
Task 2: Install Management Agents
Stack Monitoring, Log Analytics, and Database Management require Management Agents to discover and manage your resources. Once installed, enable all the O&M plugins.
- Install Management Agents
Refer to OCI guide on Management Agents for detailed installation instructions. - Enable O&M plugins for the Management Agents
Ensure that the plugins are checked for Stack Monitoring, Log Analytics, and Database Management.
Description of the illustration mgmt_agent_plugins.png
Task 3: Enable O&M Services
Some configuration steps are required to enable the remaining O&M services.
- Stack Monitoring
Follow the OCI Stack Monitoring documentation. for discovering EBS stack components. Ensure that discovery is applied for both Stack Monitoring and Log Analytics. - Log Analytics
Follow the OCI Log Analytics documentation to point the Management Agent to the location of EBS log files. - Database Management
Enable DBM for your database targets using the OCI Database Management documentation. - Ops Insights
Enable Ops Insights for your targets using the OCI Ops Insights documentation.
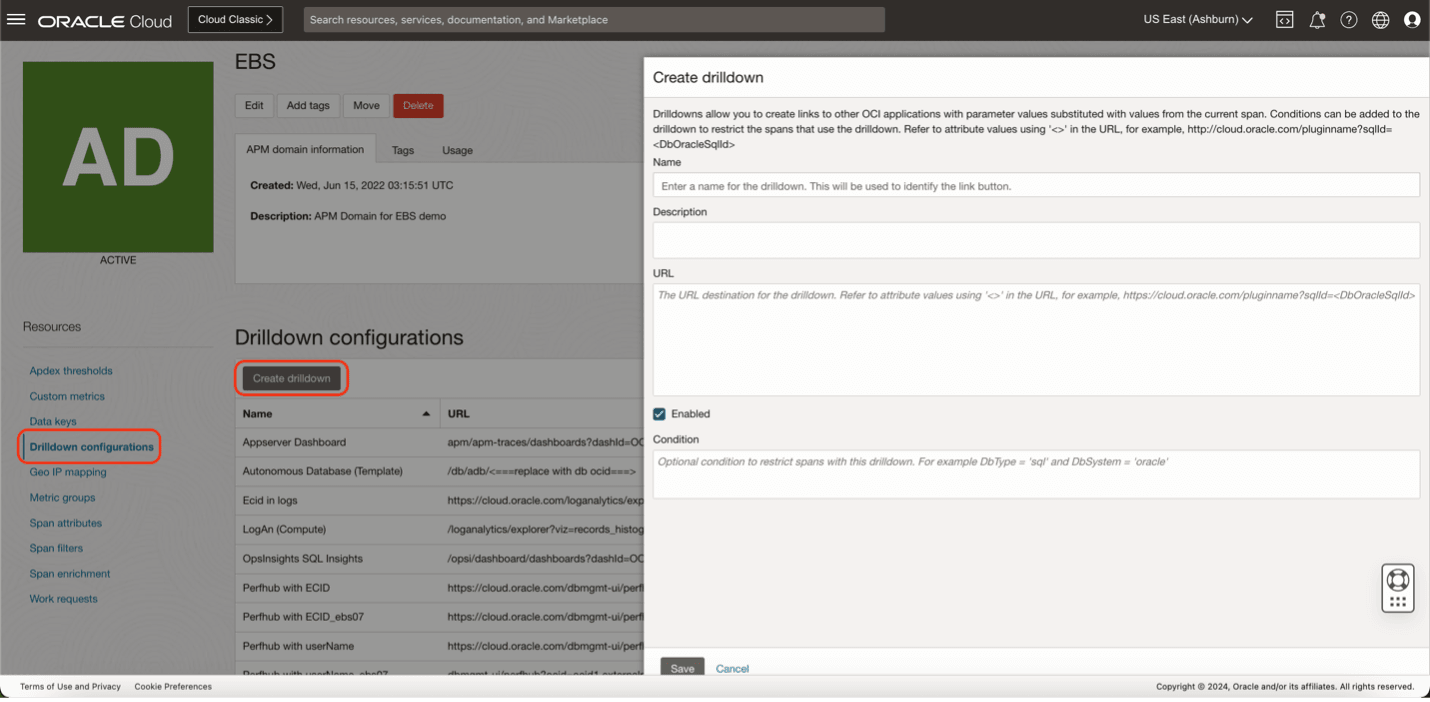
Task 4: Configure APM Drilldowns
Create custom drilldowns from APM traces to other O&M services like DBM's Performance Hub.
- Navigate to Observability & Managemen, then Application Performance Monitoring, and select Administration in the OCI console.
- Select the APM domain created earlier and click Drilldown Configuration.
- Provide a name, description, and URL for the drilldown. Use placeholders (e.g., <span_attribute>) to reference trace context dynamically. See APM Drilldown Configuration Examples for URLs that you can use.
- Save the configuration.
Task 5: Create Metric Extensions
Create custom metrics in Stack Monitoring to represent data collected from the various EBS stack layers. For example, you can collect data on long-running concurrent requests from the EBS environment's Pluggable Database and use that as a metric.
- Download the Long Running Concurrent Request Metric Extrension template
GitHub Link - Import the Metric Extension in Stack Monitoring

Description of the illustration importME.png
Task 6: Import EBS Admin Dashboard
You can view data from all the O&M services on a single page using custom dashboards.
- Download the EBS Admin Dashboard
GitHub Link - Import the Dashboard in OCI

Description of the illustration import_dashboard.png - Adjust filters to match your environment

Description of the illustration dashboard_filters.png
Task 7: Deploy OCI Marketplace App (for EBS deployments on OCI)
From the OCI marketplace, launch the E-Business Suite Monitoring on OCI app. This will provide 300+ scheduled SQL functional checks in areas such as:
- Accounts Receivables
- Accounts Payable
- General Ledger
- Payroll
- HR
- Invoices
- And more
Examples
APM Drilldown Configuration Examples
Here are sample URLs for configuring drilldowns to DBM, Log Analytics, and Ops Insights.
Drilldown to Performance Hub by SQL ID
Replace [PDB OCID] with your database's OCID.
dbmgmt-ui/perfhub?ocid=[PDB OCID]&perfhubContext={
	"dateTime": {
		"startDate":,
		"endDate":
	},
	"viewPort": {
		"startDate": "",
		"endDate": ""
	},
	"selectedTab": {
		"name": "activityTab",
		"filters": [
			{
				"key": "filter_list",
				"value": "{\"sqlid\":{\"value\":\"\",\"disabled\":false}}"
			}
		]
	}
}
Drilldown to Log Analytics by ECID
https://cloud.oracle.com/loganalytics/explorer?viz=records_histogram&query=ECID%20%3D%20%27<ECID>%27%20%7C%20timestats%20count%20as%20logrecords%20by%20%27Log%20Source%27&vizOptions=%7B%22customVizOpt%22%3A%7B%22primaryFieldIname%22%3A%22mbody%22%2C%22primaryFieldDname%22%3A%22Original%20Log%20Content%22%7D%7D&scopeFilters=lg%3Aroot%2Ctrue%3Brs%3A<OciCompartmentId>%2Ctrue&startTime=<APMStartTimeMs>&endTime=<APMEndTimeMs>®ion=<OciRegion>
Drilldown to SQL Ingihts by SQL ID
Replace [OPSI DB OCID] with your database's Ops Insights OCID.
https://cloud.oracle.com/opsi/dashboard/sqlInsights?
dashId=OOBD-opsi-sql-dashboard
&dashFilter.opsiFlexFilter=<DbOracleSqlId>
&compartmentId=<OciCompartmentId>
&activeCompartmentId=<OciCompartmentId>
&dashFilter.opsiSqlId=<DbOracleSqlId>
®ion=<OciRegion>
&dashFilter.opsiDatabaseFilter=[OPSI DB OCID]
&dashFilter.opsiContext=sqlInsights
&dashFilter.compartmentId=<OciCompartmentId>
EBS Performance Triage Example
Drilldown from application transactions to SQL performance
-
Open Trace Explorer in APM and locate a trace with JDBC spans.
Use the following Trace Explorer statement to filter for JDBC spans which have an SQL ID:
show (spans) ServiceName, OperationName, DbOracleSqlId, DbOracleSessionId, DbUser, StartTime, DbStatementExecTime
where component = 'JDBC' and DbOracleSqlId is not omitted
order by DbStatementExecTime desc
- Select a JDBC span to view detailed information.
- Use the drilldown button to navigate to DBM’s Performance Hub.
- Analyze the SQL or user activity in DBM to identify and resolve bottlenecks.

EBS monitoring use cases
-
Analyzing Database Call Performance
Drill down from JDBC spans in APM to DBM Performance Hub or Ops Insights for further analysis of the SQLs and user sessions.
-
Understanding Error Context
Drill down from Forms and server traces to the corresponding logs in Log Analytics for further insights.
-
Monitoring Long-Running Concurrent Requests
Use Metric Extensions in Stack Monitoring to track long-running concurrent requests. Create alarms on the metrics or pull the data into a dashboard widget.
-
Identifying Issues in WebLogic
Create powerful log representations of WebLogic errors, stuck threads, and problem labels.
-
Monitor EBS Service Availability with Apdex
Set up proactive monitors to assess the availability and user experience of you EBS environment.
-
Gain Key Insights with EBS Admin Dashboards
Consolidate EBS observability data in custom dashboards for quick insights into EBS performance.
Next steps
To maximize the value of monitoring and triaging your EBS enviroment, follow these actionable next steps
- Collect more monitoring data from your EBS environment
- Enable new Metric Extensions in Stack Monitoring
- Create Saved Searches in Log Analytics
- Save important Trace Explorer Queries in APM
- Set Apdex thresholds for EBS services in APM
- Enable more extensive Availability Monitors
- Leverage OCI’s Observability & Monitoring ecosystem
- Set up alerts for metrics that are emitted by the various O&M services.
- Create custom dashboards with trace, log, and metric data.
- Enable Weekly News Reports in Ops Insights
Related Links
Documentation
- OCI Application Performance Monitoring Documentation
- OCI Stack Monitoring Documentation
- OCI Log Analytics Documentation
- OCI Database Management Documentation
- OCI Ops Insight Documentation
- Guide to Configuring APM with E-Business Suite
- Work with Queries in APM Trace Explorer
- APM Drilldown Configuration
- Availability Monitoring
Blog Articles
- Monitoring EBS Performance Issues with Drilldowns
- How to Monitor and Diagnose Oracle E-Business Suite Performance Issues with OCI Application Performance Monitoring
- Top 10 Tips for monitoring E-Business Suite in Stack Monitoring
- Oracle EBS: Streamline Business and IT Ops with Log Analytics
- Improve insight into E-Business Suite performance with tracing
GitHub Link
Acknowledgements
- Authors - Zyaad Khader (Principal Member of Technical Staff)
More Learning Resources
Explore other labs on docs.oracle.com/learn or access more free learning content on the Oracle Learning YouTube channel. Additionally, visit education.oracle.com/learning-explorer to become an Oracle Learning Explorer.
For product documentation, visit Oracle Help Center.
Observability and Management Solution: Comprehensive E-Business Suite Observability
G25973-03
July 2025
Copyright © 2025 Oracle and/or its affiliates.